Fig. 2
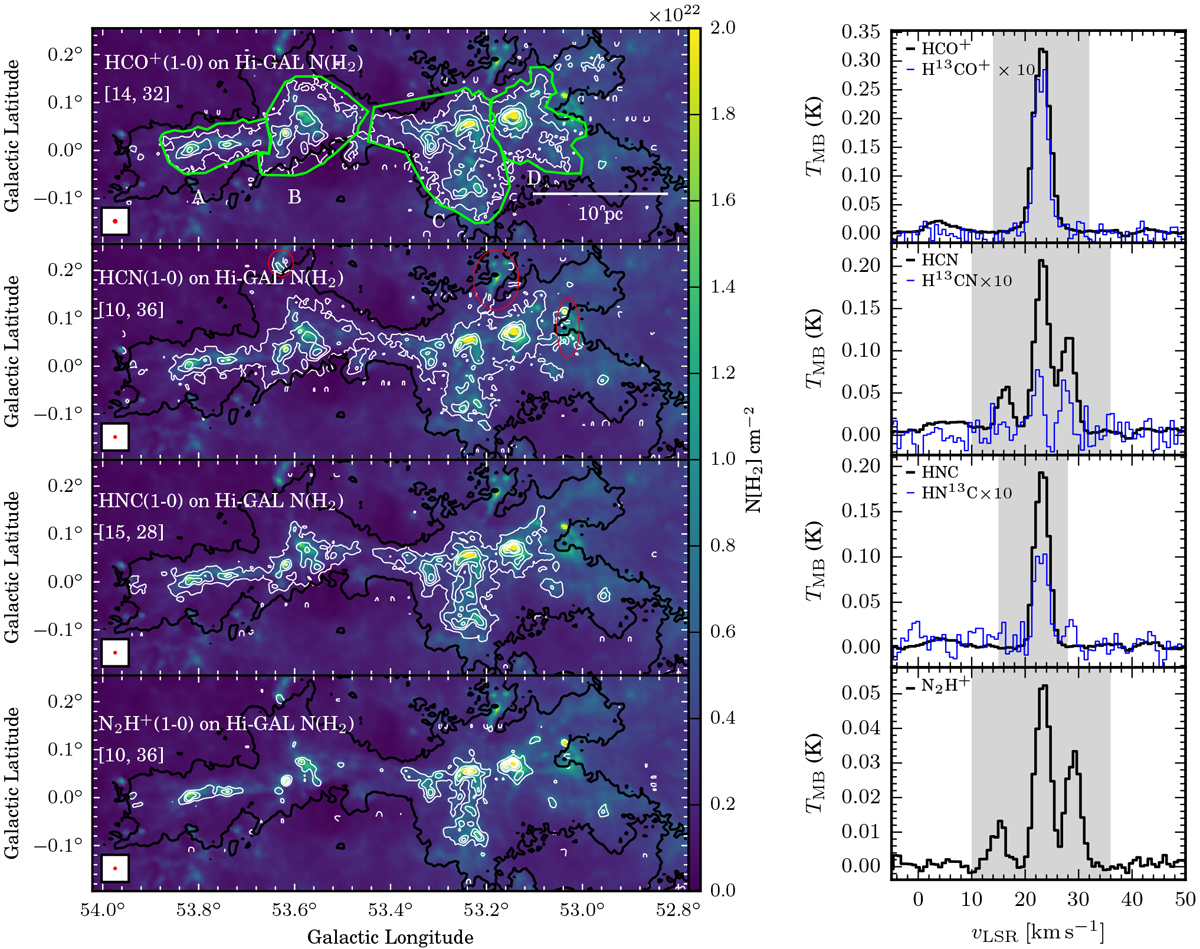
Left panels: integrated intensity contours of the HCO+(1–0), HCN(1–0), HNC(1–0), and N2H+(1–0) overlaid on the molecular hydrogen column density map derived from fitting Hi-GAL 160, 250, 350, and 500 μm continuum maps (Zucker et al. 2018). Contour levels are 3, 9, 15, 25, and 35 times of the respective σ of each integrated intensity map. The noise level of each panel from top to bottom: 0.28, 0.40, 0.22, and 0.29 K km s−1, respectively. The integral velocity range for each line is labeled in each panel in units of km s−1. The polygons in the HCO+(1–0) panel outline the four sub-regions, A, B, C, and D, which we studied in Sect. 3.3. The thick black contour in each panel traces the 5σ level of the GRS 13CO(1–0) integrated intensity. The red ellipses mark the emissions that are at a different distance and not associated with the filament. The beam of the molecular line emission (32′′) is marked in the bottom left of each panel. Right panels: average spectra of the dense gas tracers across the filament. The thick black spectra are HCO+ (1–0), HCN(1–0), HNC(1–0), and N2H+(1–0) lines, respectively. The thin blue spectra are the 13C isotopologues that are scaled up by a factor of ten. The shades mark the integral velocity range for each line.
Current usage metrics show cumulative count of Article Views (full-text article views including HTML views, PDF and ePub downloads, according to the available data) and Abstracts Views on Vision4Press platform.
Data correspond to usage on the plateform after 2015. The current usage metrics is available 48-96 hours after online publication and is updated daily on week days.
Initial download of the metrics may take a while.