Open Access
Fig. A.2
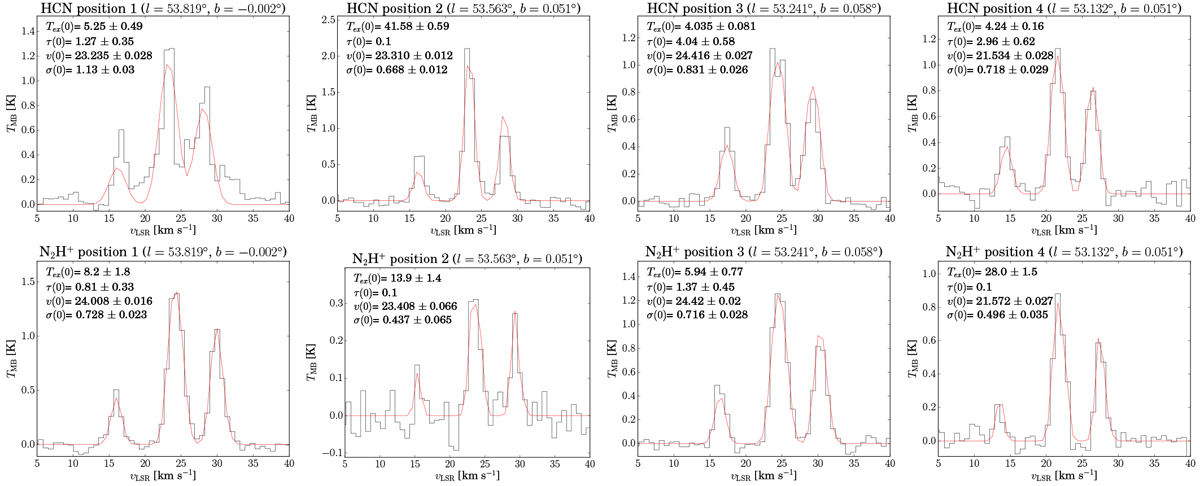
Selected HCN(1–0) (top) and N2H+(1–0) (bottom) spectra from pixels corresponding to the positions indicated in Fig. A.1. The HFS fits are shown in red. The fitting results, excitation temperature (Tex), optical depth (τ), line center (v), and line width (σ, velocity dispersion) are listed in each panel.
Current usage metrics show cumulative count of Article Views (full-text article views including HTML views, PDF and ePub downloads, according to the available data) and Abstracts Views on Vision4Press platform.
Data correspond to usage on the plateform after 2015. The current usage metrics is available 48-96 hours after online publication and is updated daily on week days.
Initial download of the metrics may take a while.