Fig. A.1
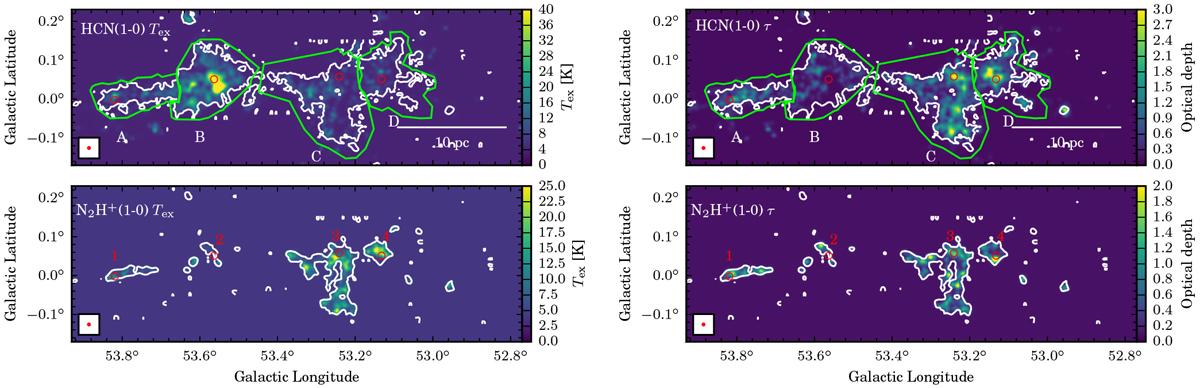
Excitation temperature (Tex, left) and optical depth (τ, right) maps derived from the HFS fitting after being convolved with a Gaussian FWHM beam of 32′′ (Gaussian kernel ~13.59′′). The thick white contour in each panel traces the 3σ level of the respective 12C isotopologue line integrated intensity shown in Fig. 2. The red circles mark the locations whose spectra are shown in Fig. A.2. The beams and polygons are the same as in Fig. 2.
Current usage metrics show cumulative count of Article Views (full-text article views including HTML views, PDF and ePub downloads, according to the available data) and Abstracts Views on Vision4Press platform.
Data correspond to usage on the plateform after 2015. The current usage metrics is available 48-96 hours after online publication and is updated daily on week days.
Initial download of the metrics may take a while.