Fig. 3.
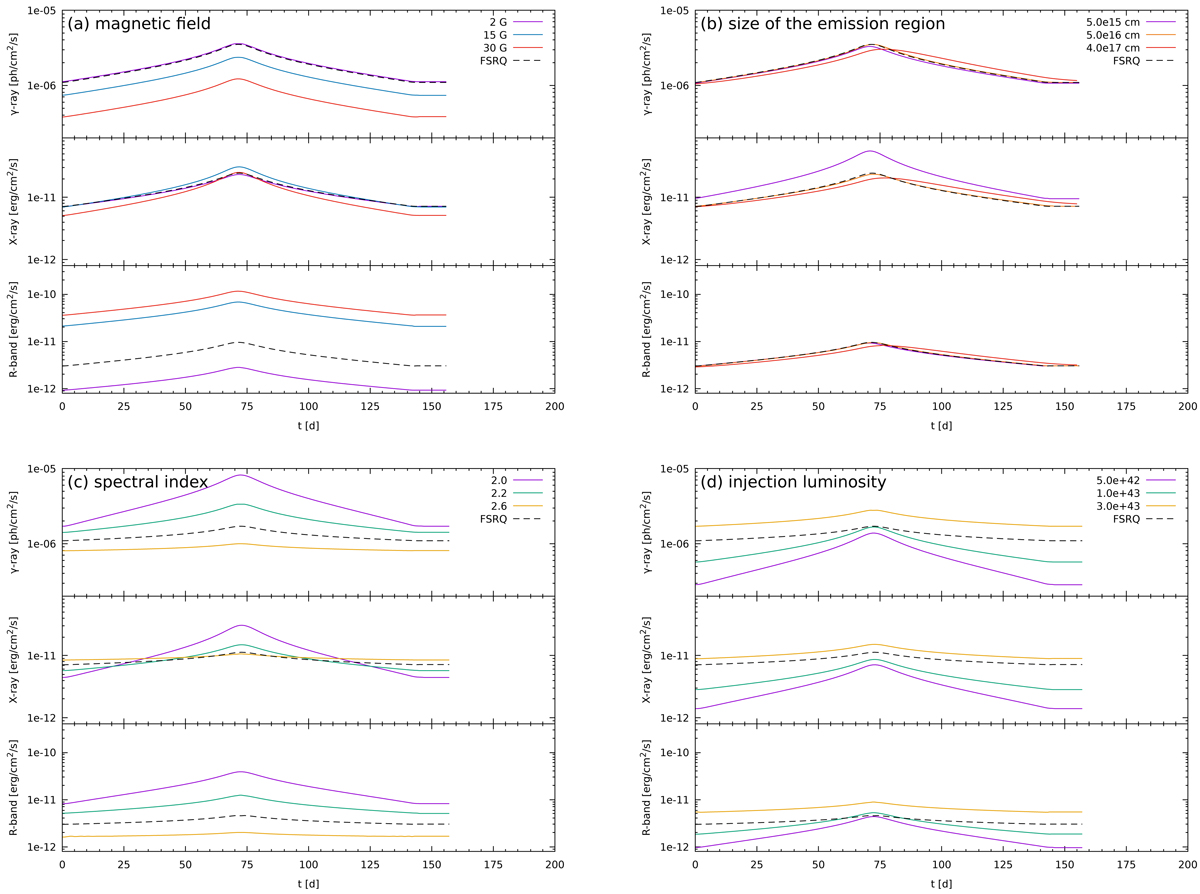
Lightcurves in the observer’s frame of theoretical clouds for different parameter values of the jet emission region. In each panel, lightcurves in the γ-ray, X-ray, and R band are shown for the following different varied parameters: (a) magnetic field ![]() , and (b) size
, and (b) size ![]() of the emission region, as well as (c) spectral index s′ of the electron distribution, and (d) the injection luminosity
of the emission region, as well as (c) spectral index s′ of the electron distribution, and (d) the injection luminosity ![]() of the quiescent state. The black-dashed line marks the lightcurve employing the FSRQ parameters given in Table 1. We note the logarithmic y-axes.
of the quiescent state. The black-dashed line marks the lightcurve employing the FSRQ parameters given in Table 1. We note the logarithmic y-axes.
Current usage metrics show cumulative count of Article Views (full-text article views including HTML views, PDF and ePub downloads, according to the available data) and Abstracts Views on Vision4Press platform.
Data correspond to usage on the plateform after 2015. The current usage metrics is available 48-96 hours after online publication and is updated daily on week days.
Initial download of the metrics may take a while.