Free Access
Fig. 9.
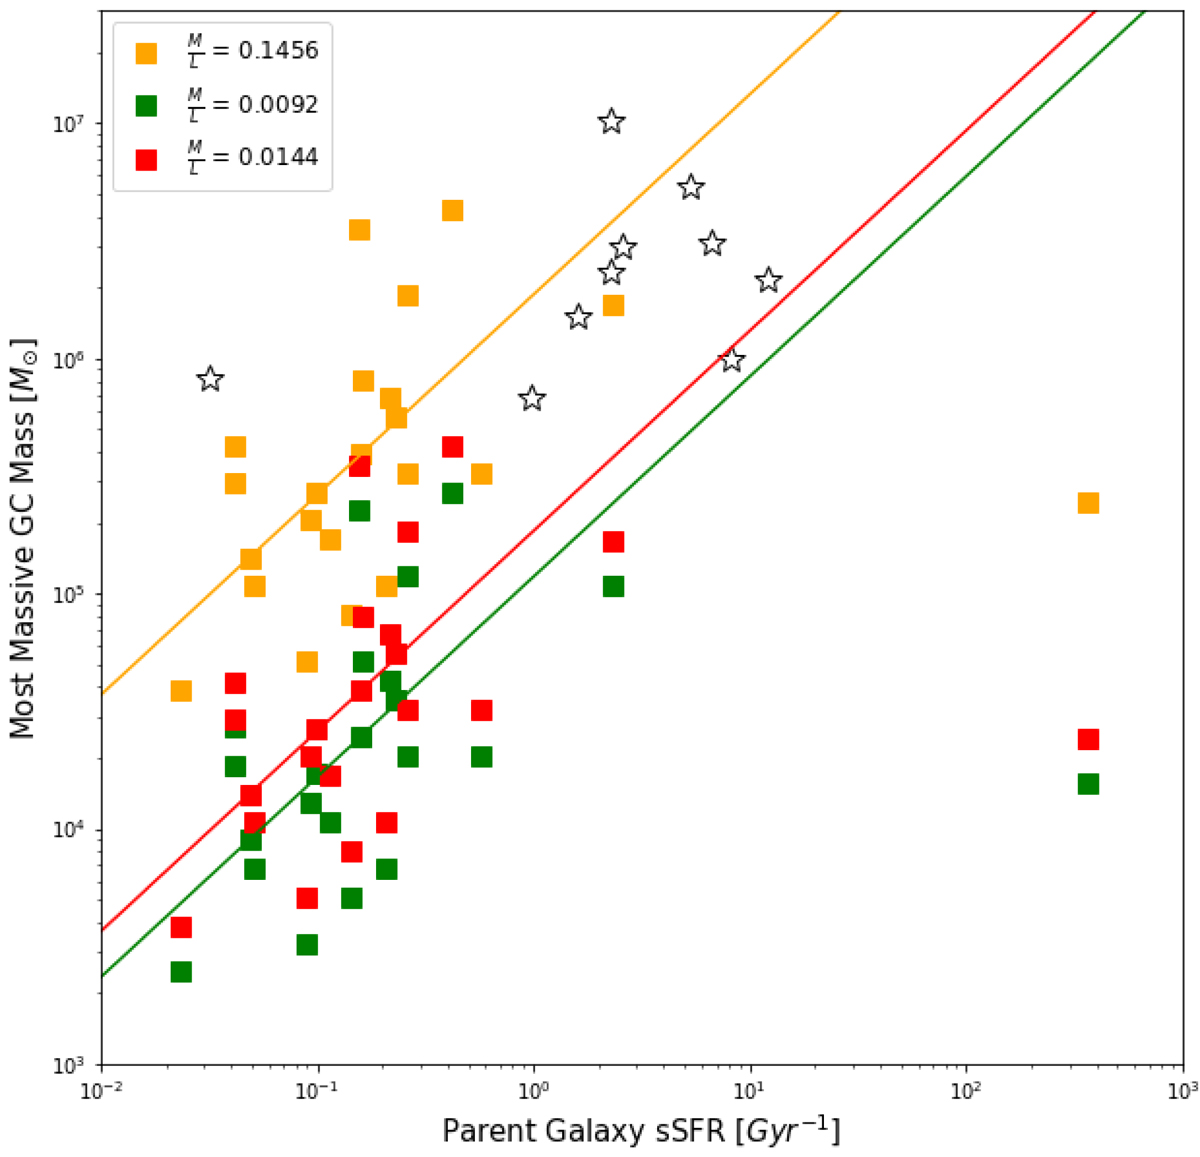
Most massive infant GC versus the sSFR of the parent galaxy. Star symbols represent data from this work and the coloured squares (red, orange and green) come from observations (see Sect. 4 for details). The straight lines are a fitted to each of the sets of observations.
Current usage metrics show cumulative count of Article Views (full-text article views including HTML views, PDF and ePub downloads, according to the available data) and Abstracts Views on Vision4Press platform.
Data correspond to usage on the plateform after 2015. The current usage metrics is available 48-96 hours after online publication and is updated daily on week days.
Initial download of the metrics may take a while.