Fig. 8.
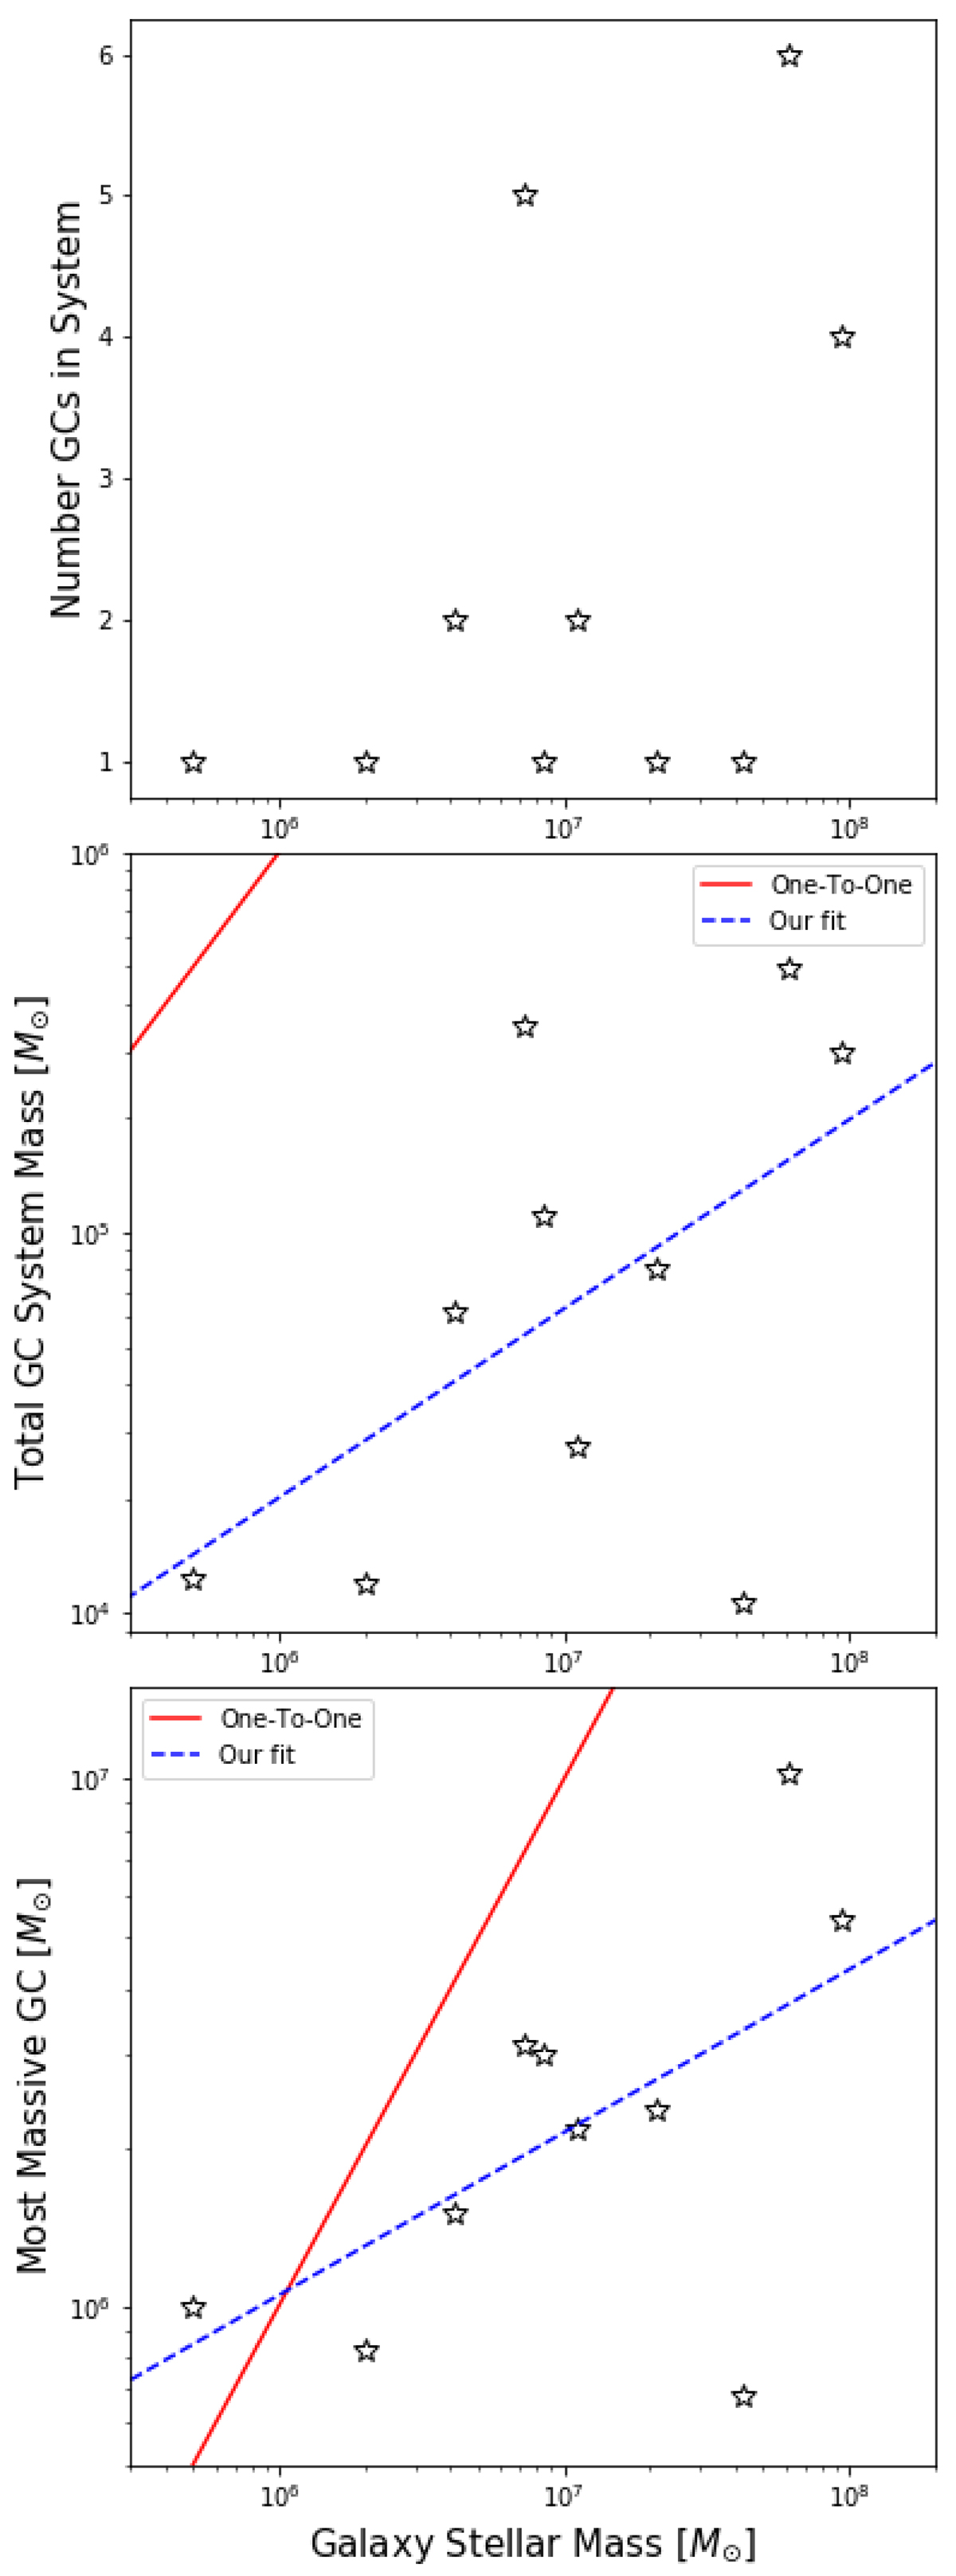
GC system number (top), GC system mass (middle) and total mass (stellar and gas) of the most massive GC (bottom) versus the stellar mass of the parent galaxy. In the middle and bottom panels, we also display the one-to-one relation (red) and our own fits to the data (blue). Further information on our fits can be found in Sect. 4.
Current usage metrics show cumulative count of Article Views (full-text article views including HTML views, PDF and ePub downloads, according to the available data) and Abstracts Views on Vision4Press platform.
Data correspond to usage on the plateform after 2015. The current usage metrics is available 48-96 hours after online publication and is updated daily on week days.
Initial download of the metrics may take a while.