Fig. 5.
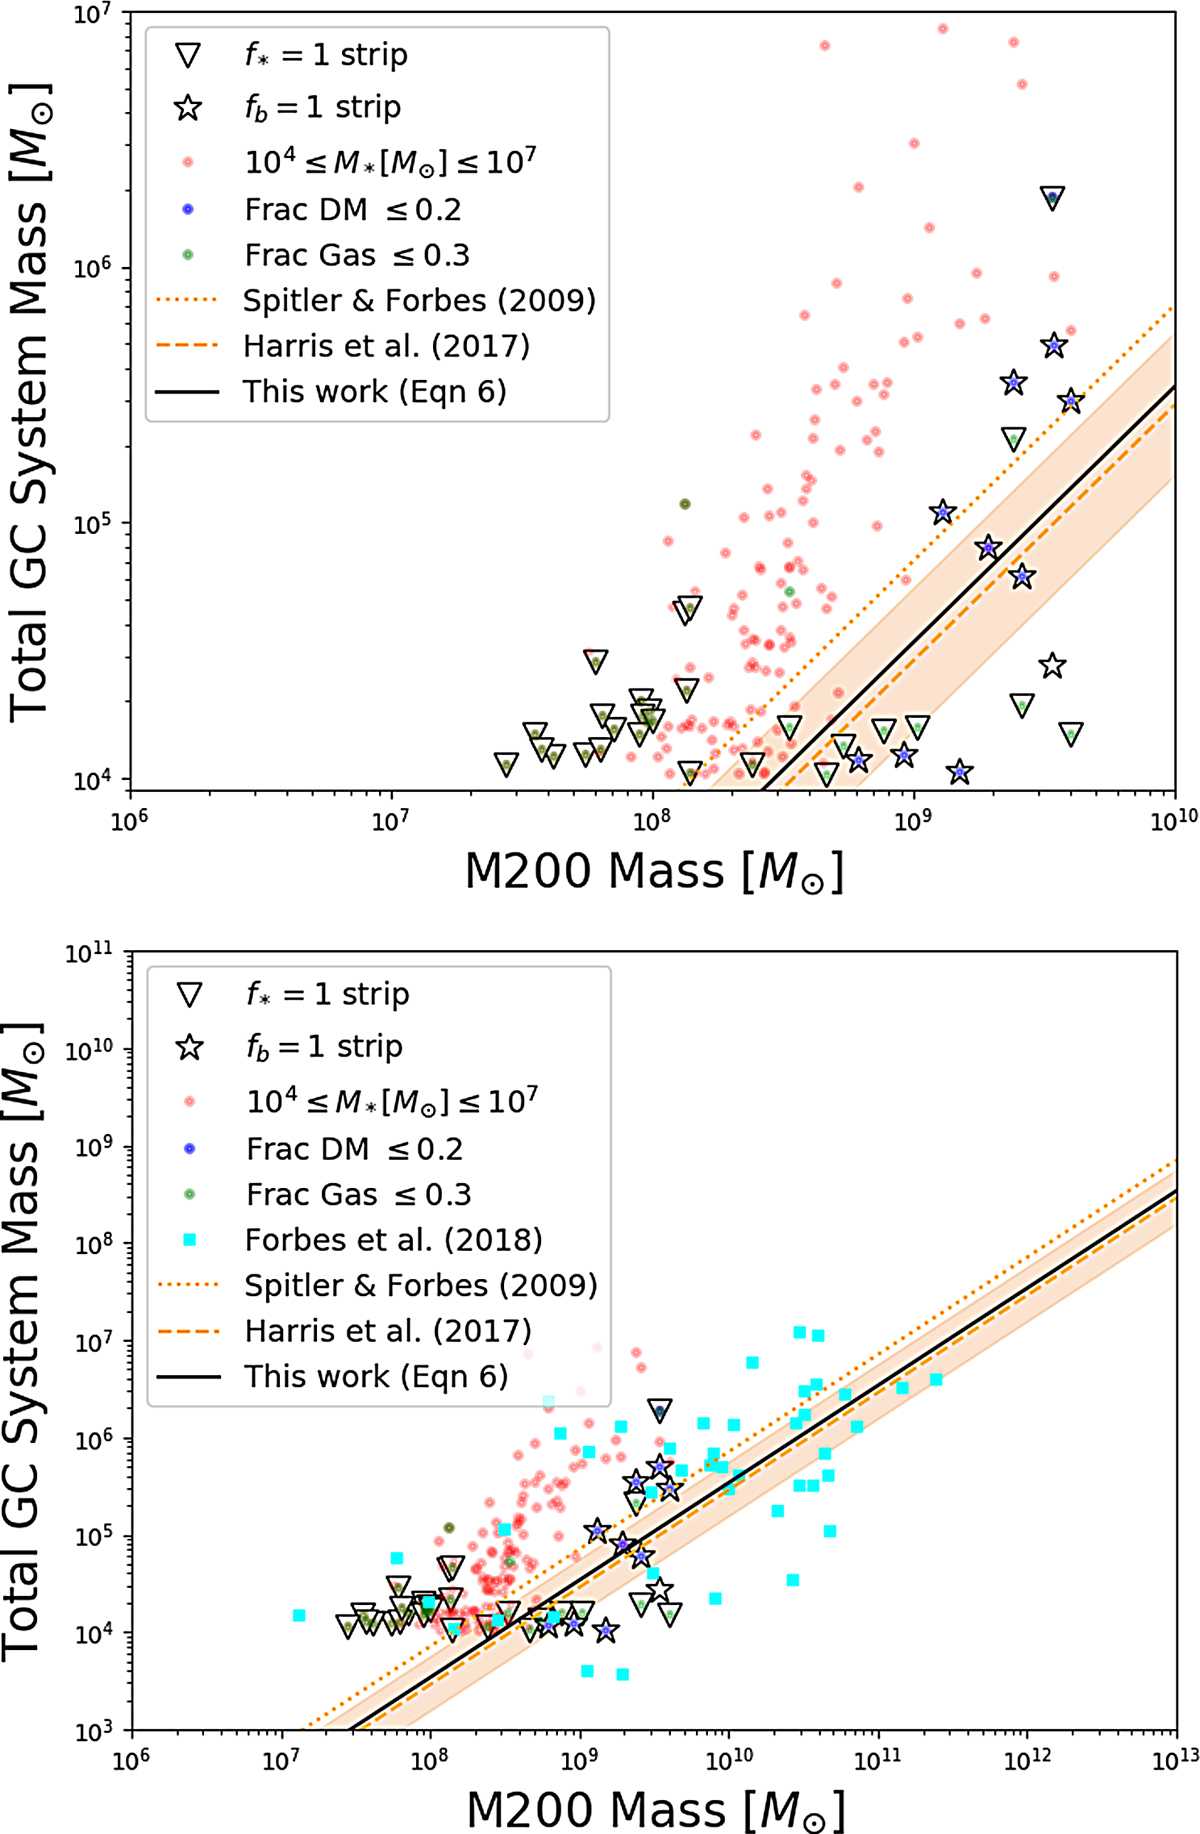
Top: total stellar mass of potential GC systems plotted against their parent halo mass. Pale dots indicate sub-samples defined using observable properties of present day GCs. Stars and triangles represent the fb = 1 and f* = 1 samples, respectively. Two of the relations plotted are taken from Spitler & Forbes (2009; solid) and Harris et al. (2017; dash). The yellow line is the relation we find for our simulated data. Bottom: same as top plot except the turquoise squares are the GC systems examined in Forbes et al. (2018a).
Current usage metrics show cumulative count of Article Views (full-text article views including HTML views, PDF and ePub downloads, according to the available data) and Abstracts Views on Vision4Press platform.
Data correspond to usage on the plateform after 2015. The current usage metrics is available 48-96 hours after online publication and is updated daily on week days.
Initial download of the metrics may take a while.