Fig. 11.
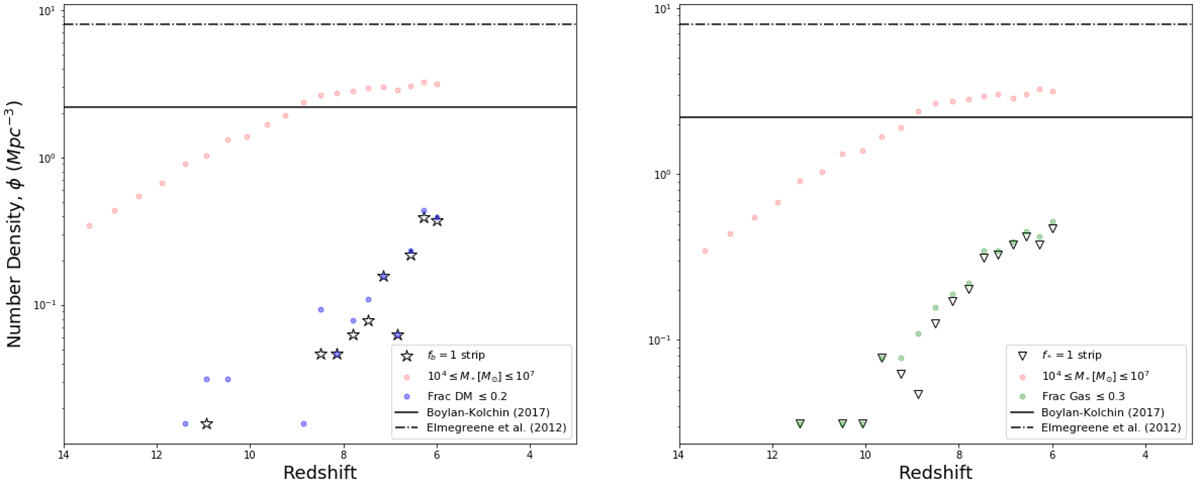
Redshift evolution of the number density of potential candidate GCs in the simulation. Stars and triangles represent the fb = 1 and f* = 1 groups. Pale coloured dots indicate the observationally constrained sub-samples we are comparing to. The solid and dot-dash lines are predicted values of ϕ taken from the literature (see legend and Sect. 6).
Current usage metrics show cumulative count of Article Views (full-text article views including HTML views, PDF and ePub downloads, according to the available data) and Abstracts Views on Vision4Press platform.
Data correspond to usage on the plateform after 2015. The current usage metrics is available 48-96 hours after online publication and is updated daily on week days.
Initial download of the metrics may take a while.