Fig. 10.
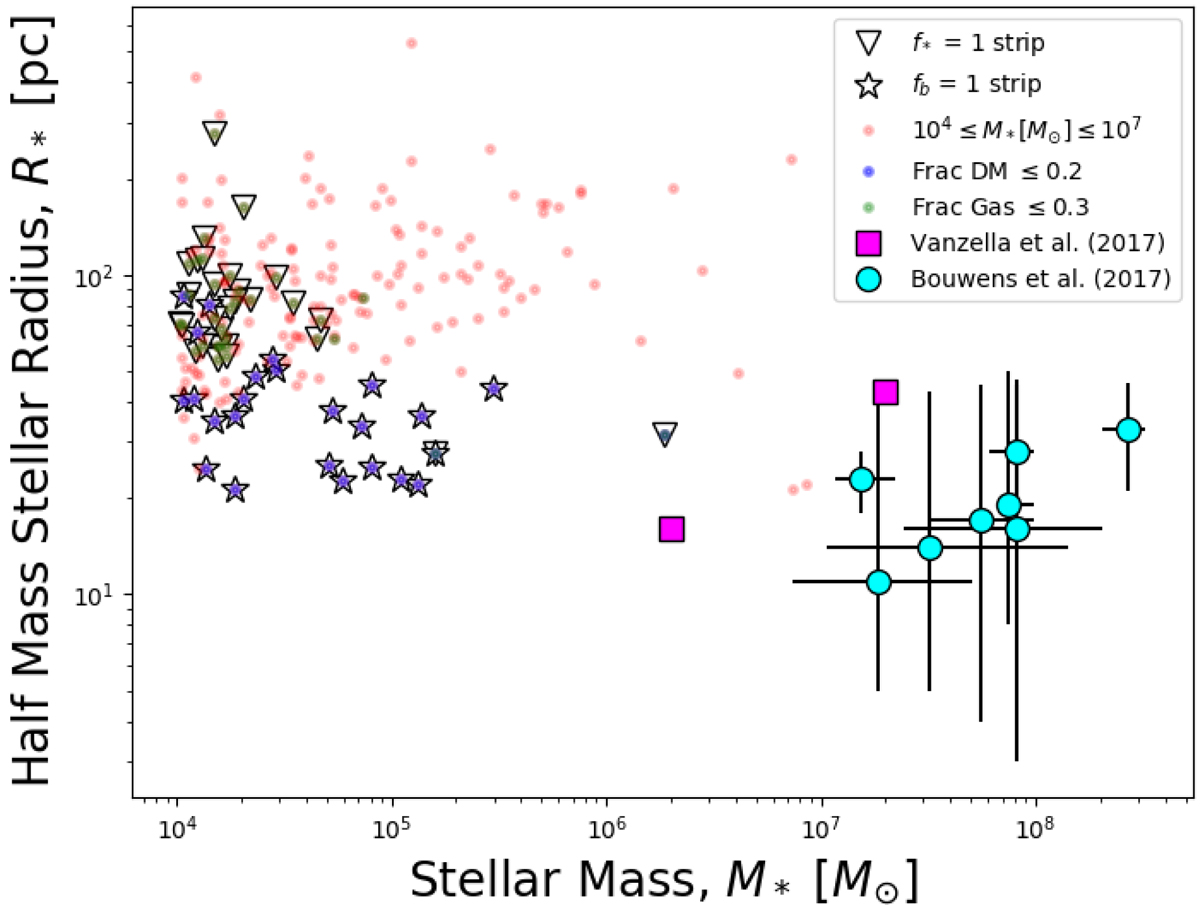
Stellar radius versus stellar mass. The green, blue and red pale dots indicate sub-samples defined using observable properties from the local Universe. Stars represent our likely infant GC candidates and triangles our proto-UFDs. The magenta circles and cyan squares are high redshift observations from Vanzella et al. (2017) and Bouwens et al. (2017) respectively. For the Bouwens et al. (2017) data, we have taken objects from their Table 2 which had a radius < 50 pc including errors.
Current usage metrics show cumulative count of Article Views (full-text article views including HTML views, PDF and ePub downloads, according to the available data) and Abstracts Views on Vision4Press platform.
Data correspond to usage on the plateform after 2015. The current usage metrics is available 48-96 hours after online publication and is updated daily on week days.
Initial download of the metrics may take a while.