Fig. 7.
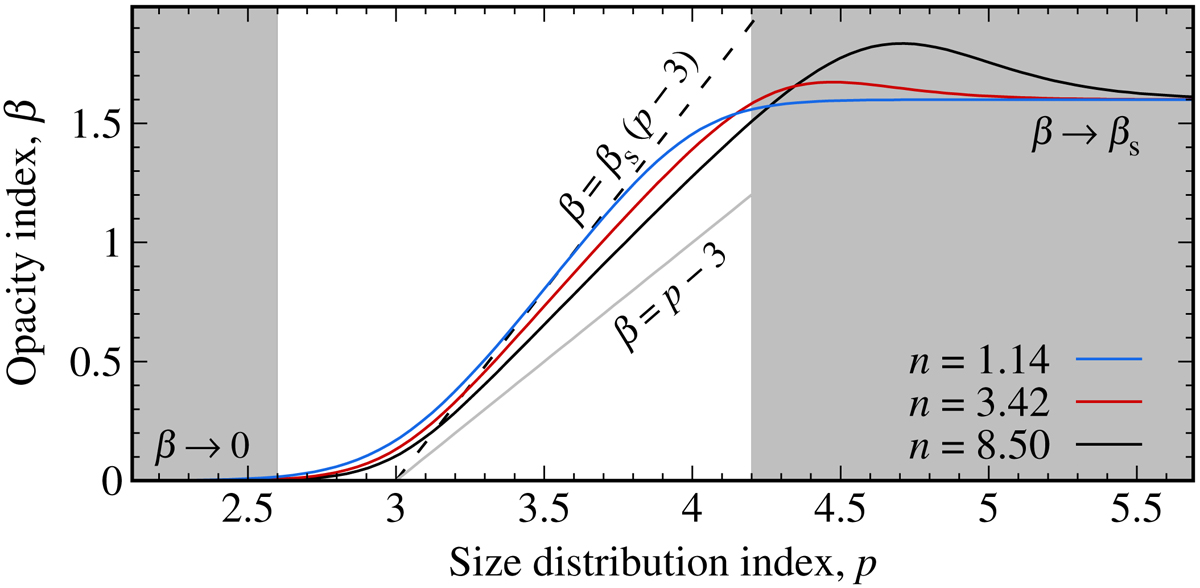
Slope of the opacity as derived from Eq. (25) for the following parameters: λ = 3 mm, βs = 1.6, A0 = 2/cm, λ0 = 1 mm, ρ = 3.5 g cm−3, smin = 0.5 μm, smax = 100 m, Qabs, o = 1, y = 0.75n2, with (black) n = 8.5, (red) n = 3.4, and (blue) n = 1.14. In the range 3 < p < 4, this order of colours reflects the vertical order of the corresponding lines, bottom to top. The dashed black and solid grey lines follow Eqs. (30) and (31), respectively.
Current usage metrics show cumulative count of Article Views (full-text article views including HTML views, PDF and ePub downloads, according to the available data) and Abstracts Views on Vision4Press platform.
Data correspond to usage on the plateform after 2015. The current usage metrics is available 48-96 hours after online publication and is updated daily on week days.
Initial download of the metrics may take a while.