Fig. 5.
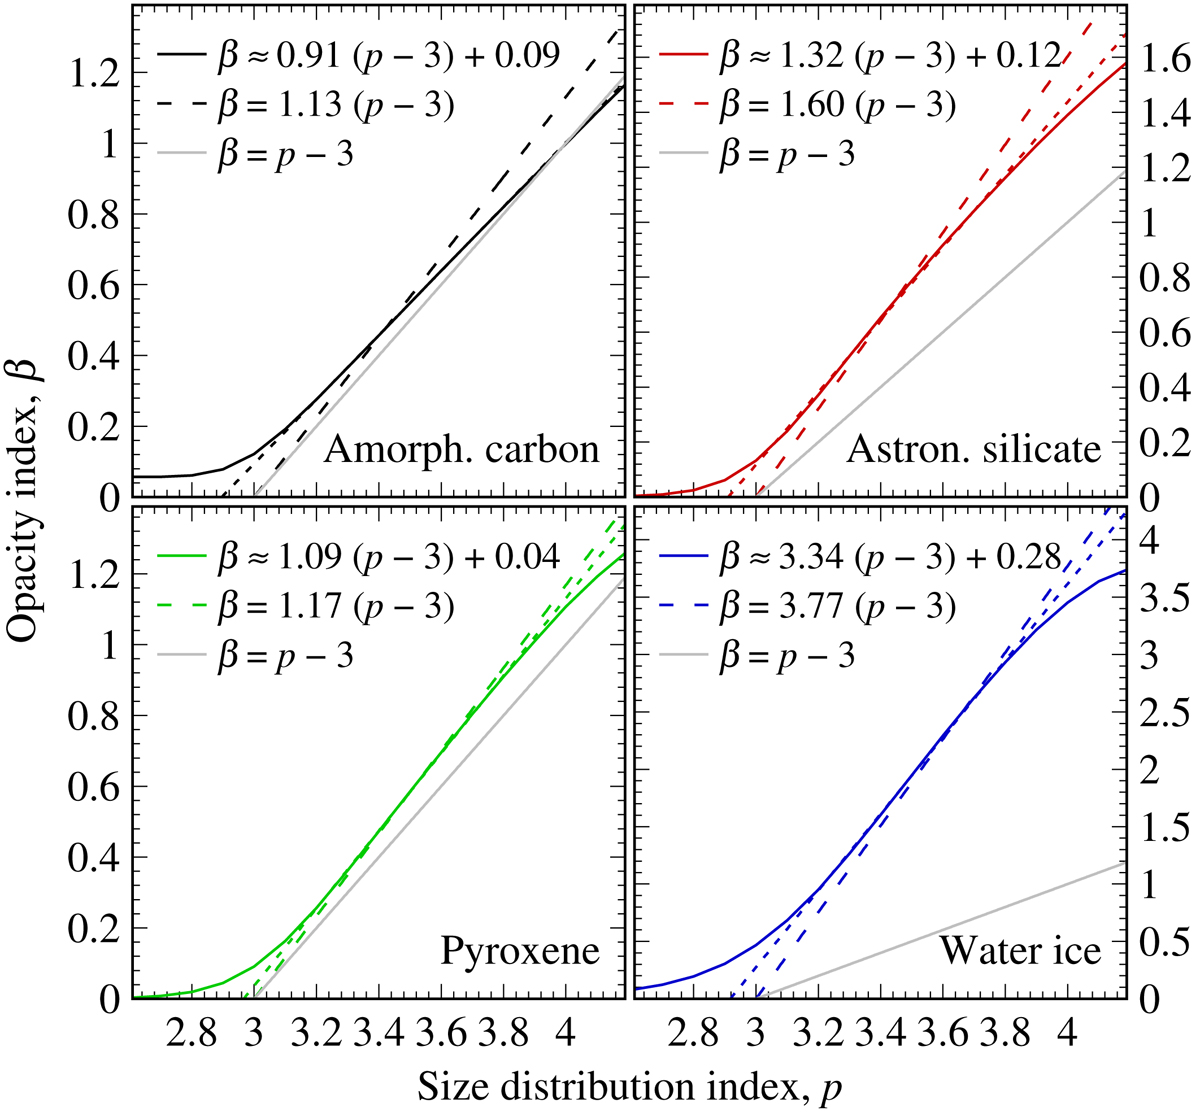
Relation between the power-law indices of the grain size distributions and the total opacities between λ1 = 1 mm and λ2 = 7 mm for four materials at r = 100 au around a star with L = L⊙. Solid coloured lines show numerical results. Dotted lines of the same colours show linear fits for 3.2 ≤ p ≤ 3.8, with fit coefficients indicated in the figure keys. Dashed lines show the analytic approximation according to Eq. (30). The solid grey lines trace the approximate Eq. (31).
Current usage metrics show cumulative count of Article Views (full-text article views including HTML views, PDF and ePub downloads, according to the available data) and Abstracts Views on Vision4Press platform.
Data correspond to usage on the plateform after 2015. The current usage metrics is available 48-96 hours after online publication and is updated daily on week days.
Initial download of the metrics may take a while.