Fig. 3.
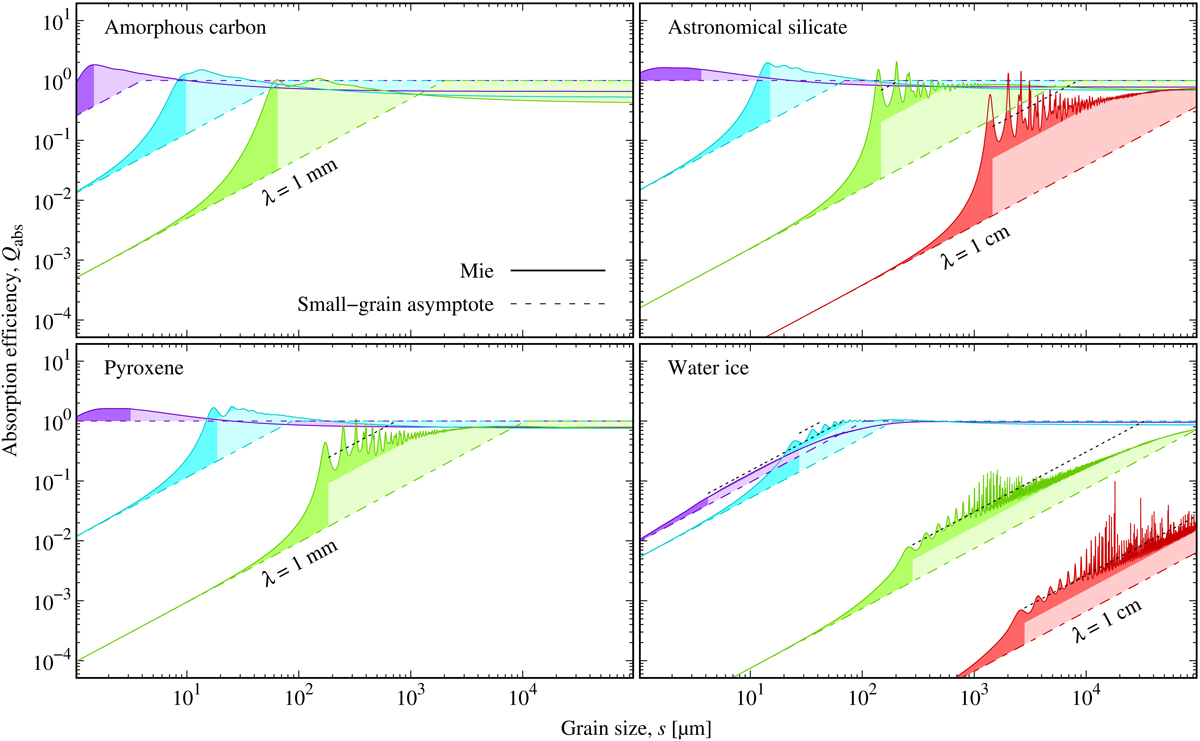
Absorption efficiencies for four materials and a range of wavelengths and grain sizes. Wavelength are separated by factors of 10, the longest wavelengths are labelled. Solid lines indicate Mie results, dashed lines the small-grain asymptote given in Eq. (12). The upper boundaries of the light-shaded regions are defined by Eq. (13), the left boundaries by Eq. (15). Black dotted lines follow Eq. (13) multiplied by an additional factor n to roughly trace the actual smoothed Qabs. Values are given for stellar luminosity L = LSun and a distance r = 100 au.
Current usage metrics show cumulative count of Article Views (full-text article views including HTML views, PDF and ePub downloads, according to the available data) and Abstracts Views on Vision4Press platform.
Data correspond to usage on the plateform after 2015. The current usage metrics is available 48-96 hours after online publication and is updated daily on week days.
Initial download of the metrics may take a while.