Fig. 10.
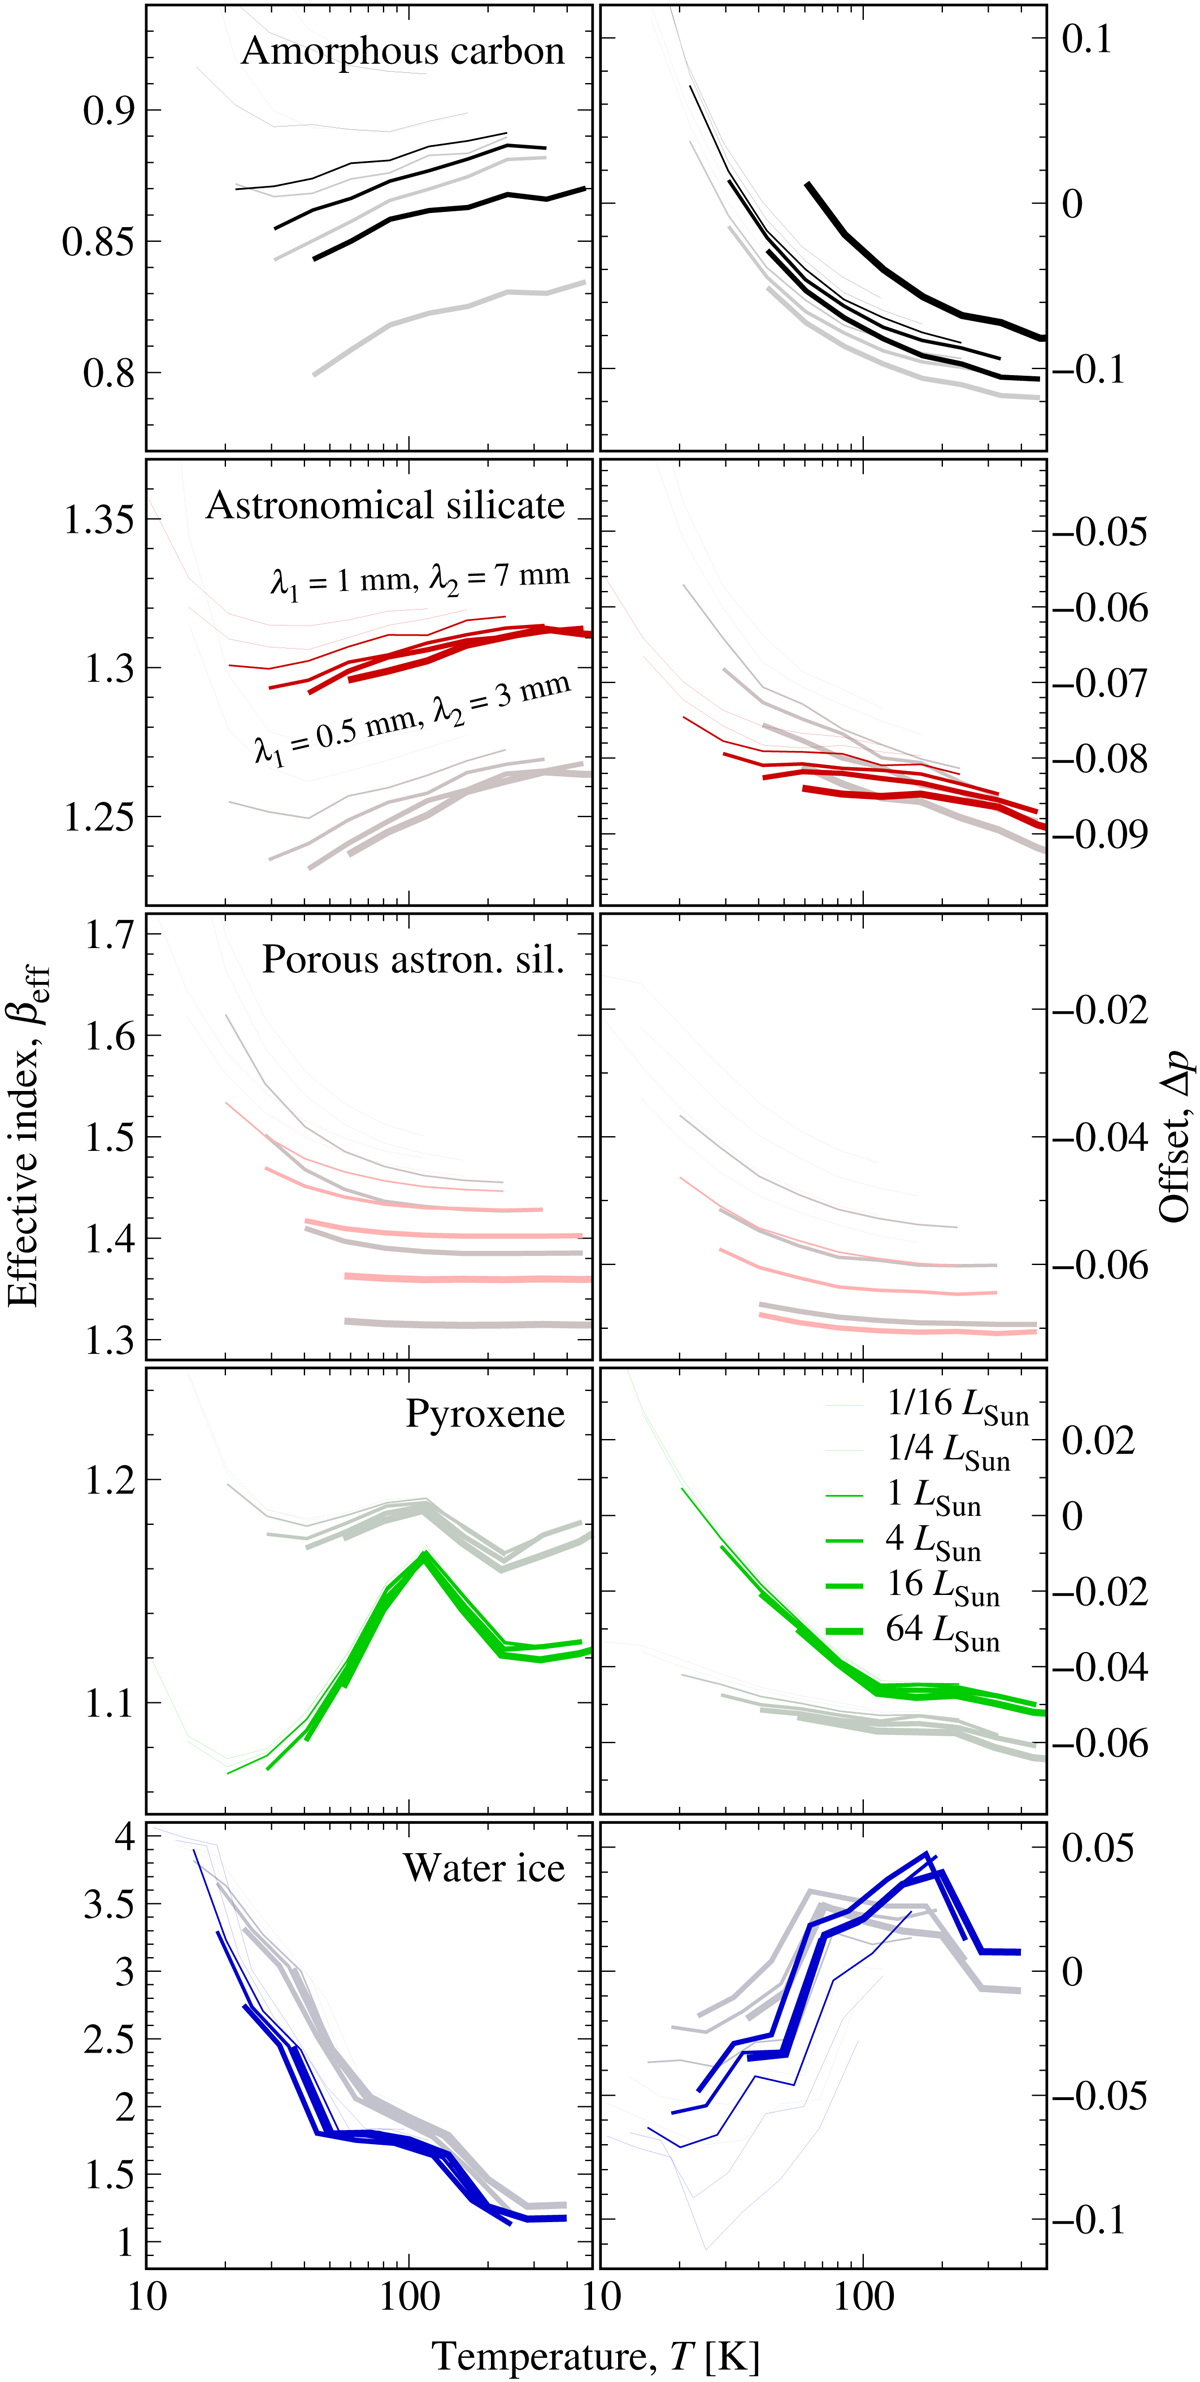
Regression coefficients for linear fits to the modelled relation between observable spectral slope αmm and the size distribution index p as defined in Eq. (33). Coloured lines indicate values for longer wavelengths, grey lines for short wavelengths. Line width increases with stellar luminosity from L = 0.0625 L⊙ to L = 64 L⊙.
Current usage metrics show cumulative count of Article Views (full-text article views including HTML views, PDF and ePub downloads, according to the available data) and Abstracts Views on Vision4Press platform.
Data correspond to usage on the plateform after 2015. The current usage metrics is available 48-96 hours after online publication and is updated daily on week days.
Initial download of the metrics may take a while.