Fig. 9.
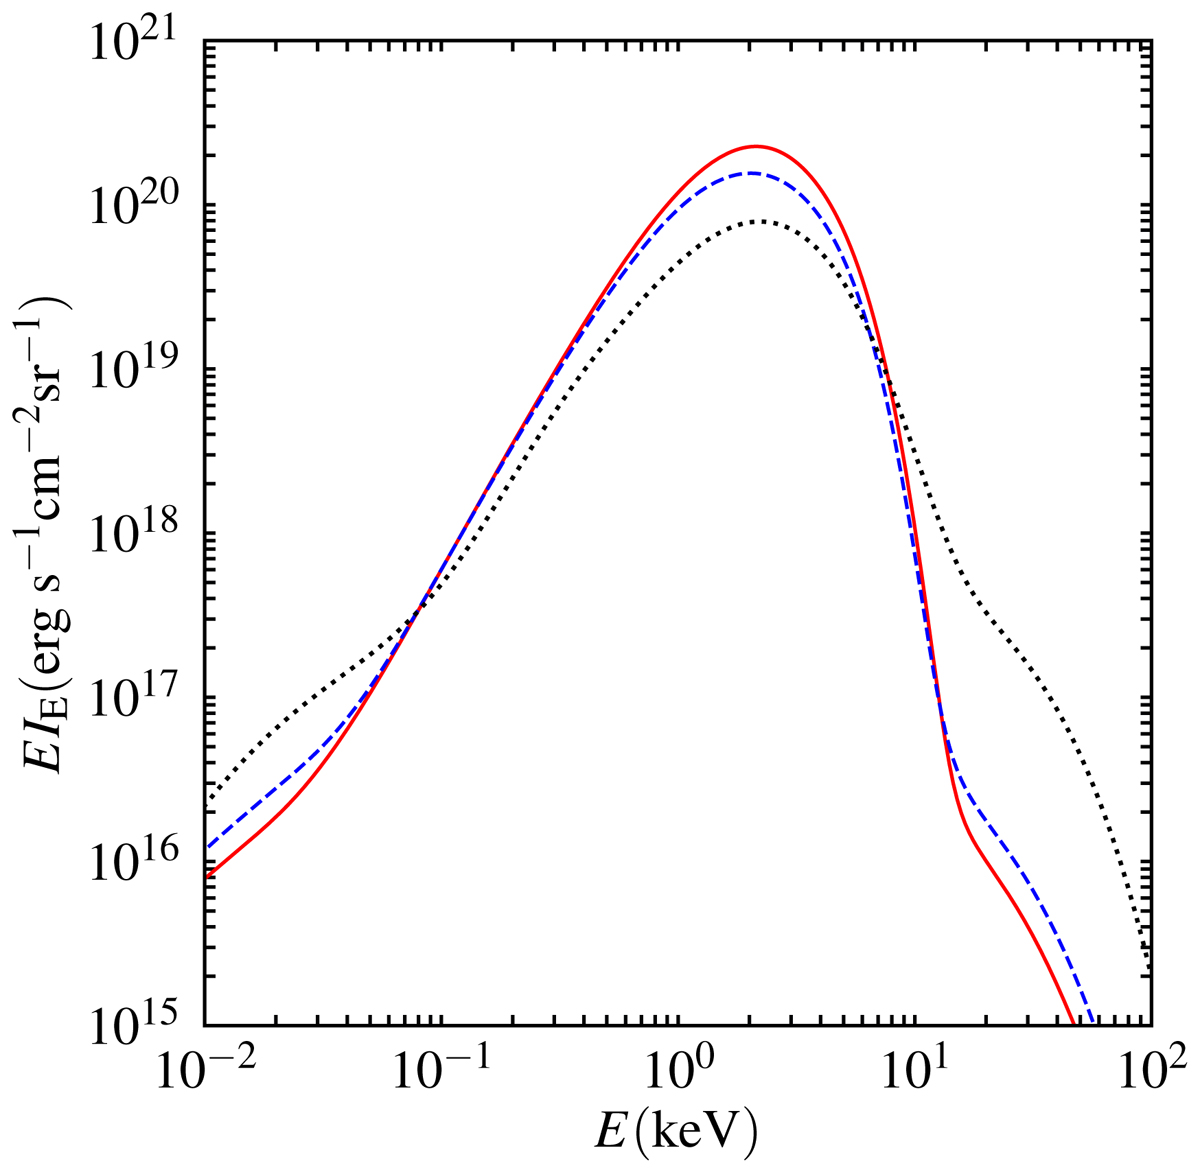
Emergent specific intensity spectra for power-law distribution of the particle beam for the NS atmosphere model shown in Fig. 4 in case of δ = 2 and γmin = 10. The results are shown for three emission angles (out of the eleven that were computed): μ = 0.99 (red solid curve), μ = 0.50 (blue dashed), and μ = 0.01 (black dotted).
Current usage metrics show cumulative count of Article Views (full-text article views including HTML views, PDF and ePub downloads, according to the available data) and Abstracts Views on Vision4Press platform.
Data correspond to usage on the plateform after 2015. The current usage metrics is available 48-96 hours after online publication and is updated daily on week days.
Initial download of the metrics may take a while.