Fig. 8.
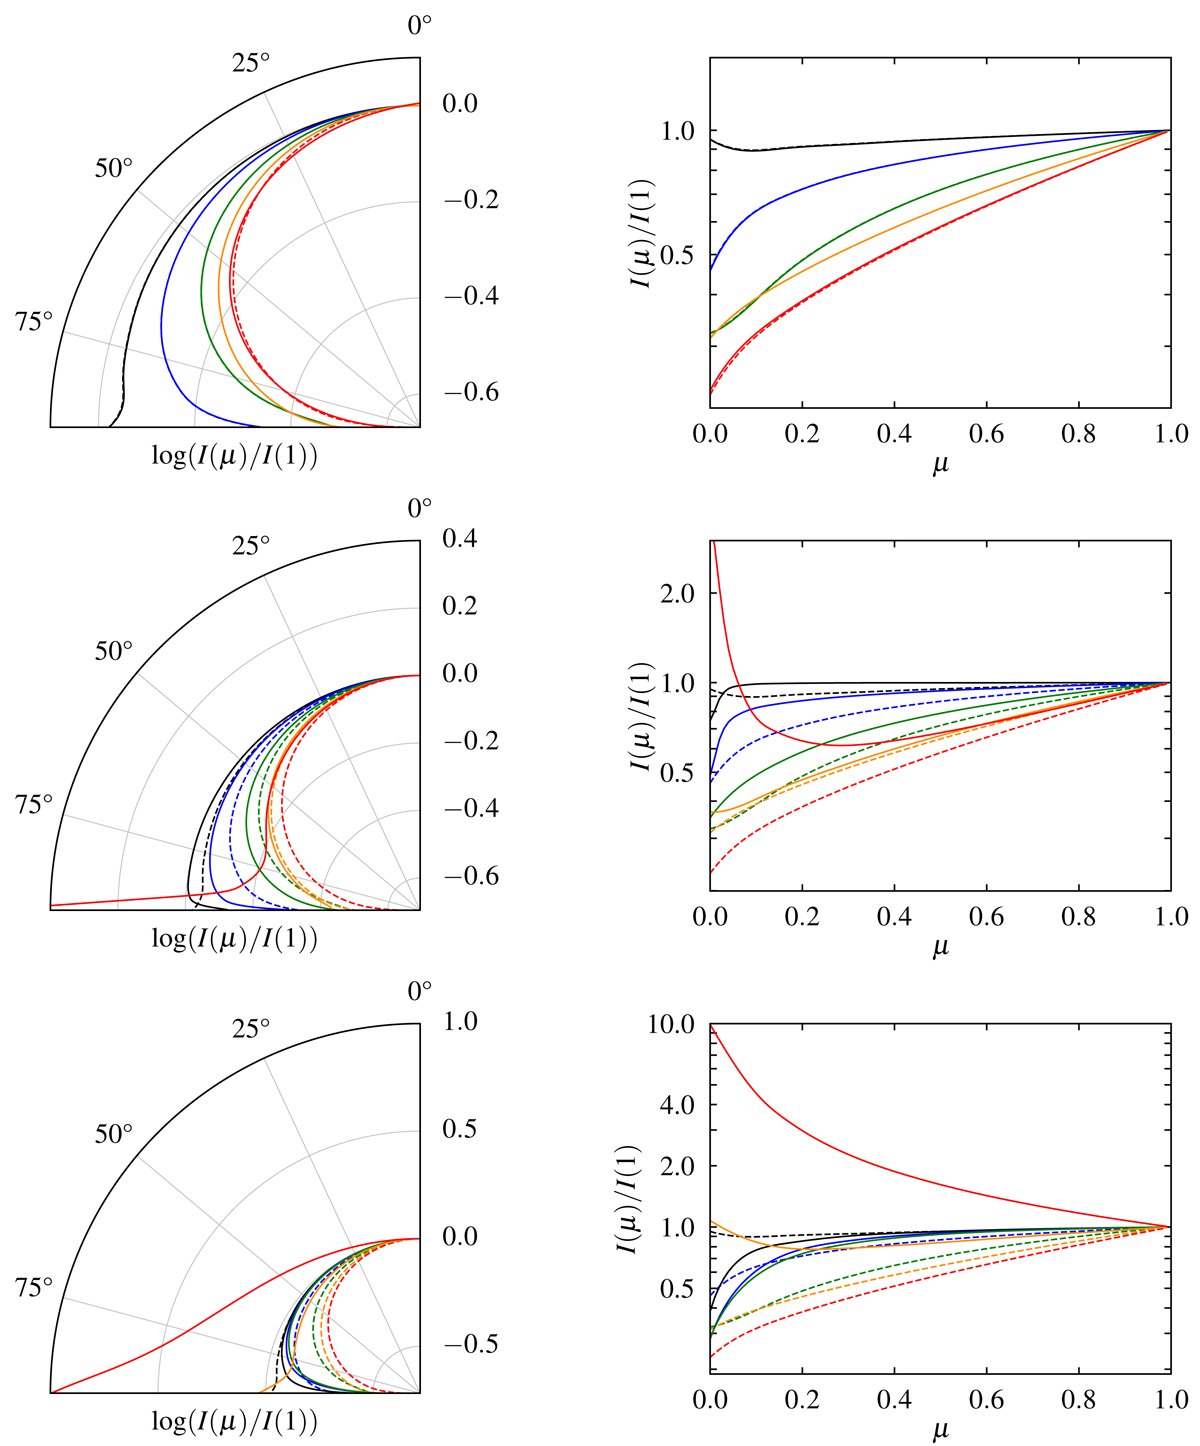
Emission pattern of the specific intensity in polar (left) and Cartesian (right) coordinates for the NS atmosphere models presented in Fig. 4. The dashed curves show the patterns for non-heated atmosphere model, and the solid curves are for a power-law distribution of return current particles. Top, middle and bottom panels correspond to δ = 1, 2 and 3, respectively. The black, blue, green, orange, and red colours correspond to intensities at 0.1, 0.3, 1, 3, and 10 keV, respectively.
Current usage metrics show cumulative count of Article Views (full-text article views including HTML views, PDF and ePub downloads, according to the available data) and Abstracts Views on Vision4Press platform.
Data correspond to usage on the plateform after 2015. The current usage metrics is available 48-96 hours after online publication and is updated daily on week days.
Initial download of the metrics may take a while.