Fig. 2.
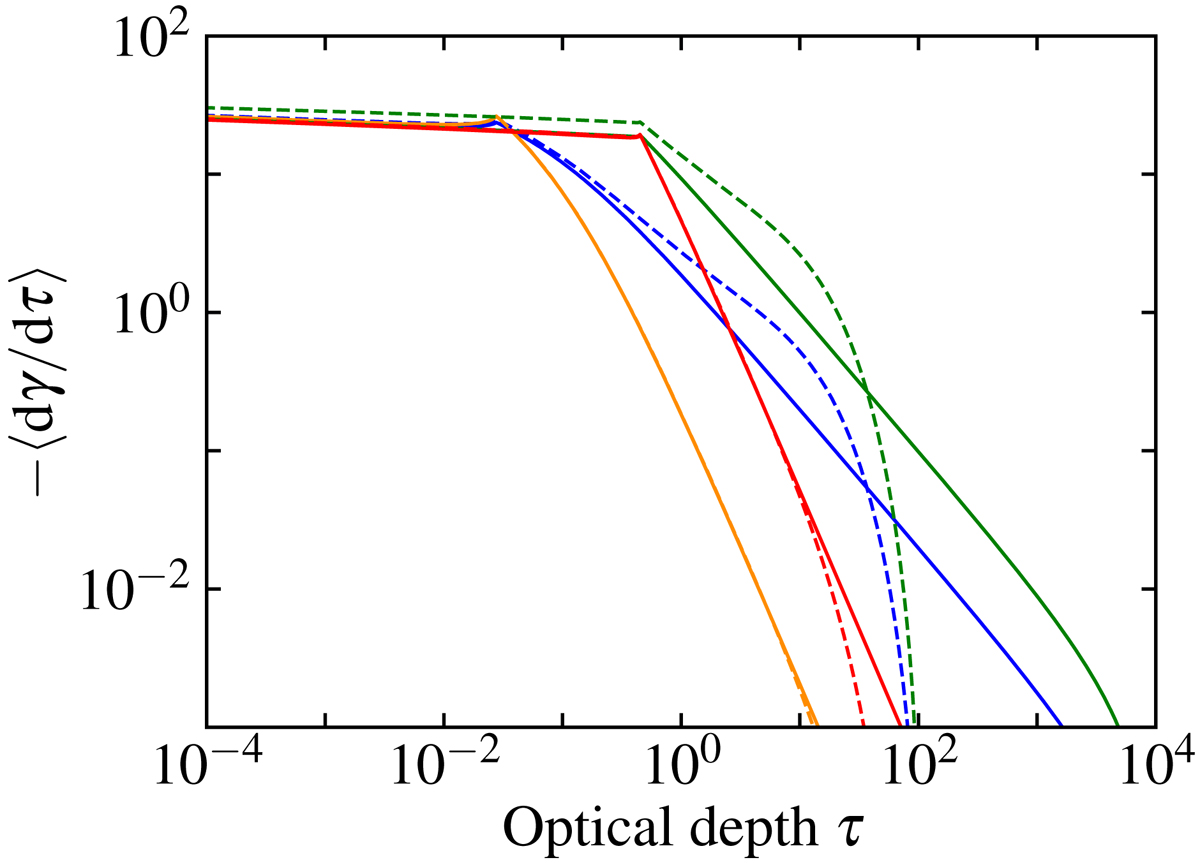
Comparison of average electron deceleration (see the definition in Sect. 3.1) for multi-energetic particles using grey atmosphere with different power-law indices δ and minimum cutoff energies γmin (cf. Fig. 5 in Bauböck et al. 2019). The green curve is for δ = 2 and γmin = 10, the blue curve for δ = 2 and γmin = 2, the red curve for δ = 3 and γmin = 10, and the orange curve for δ = 3 and γmin = 2; in all cases the upper limit for the energy distribution is γmax = 2 × 10⁵. The dashed curves present the results where the bremsstrahlung losses are taken into account.
Current usage metrics show cumulative count of Article Views (full-text article views including HTML views, PDF and ePub downloads, according to the available data) and Abstracts Views on Vision4Press platform.
Data correspond to usage on the plateform after 2015. The current usage metrics is available 48-96 hours after online publication and is updated daily on week days.
Initial download of the metrics may take a while.