Fig. 9.
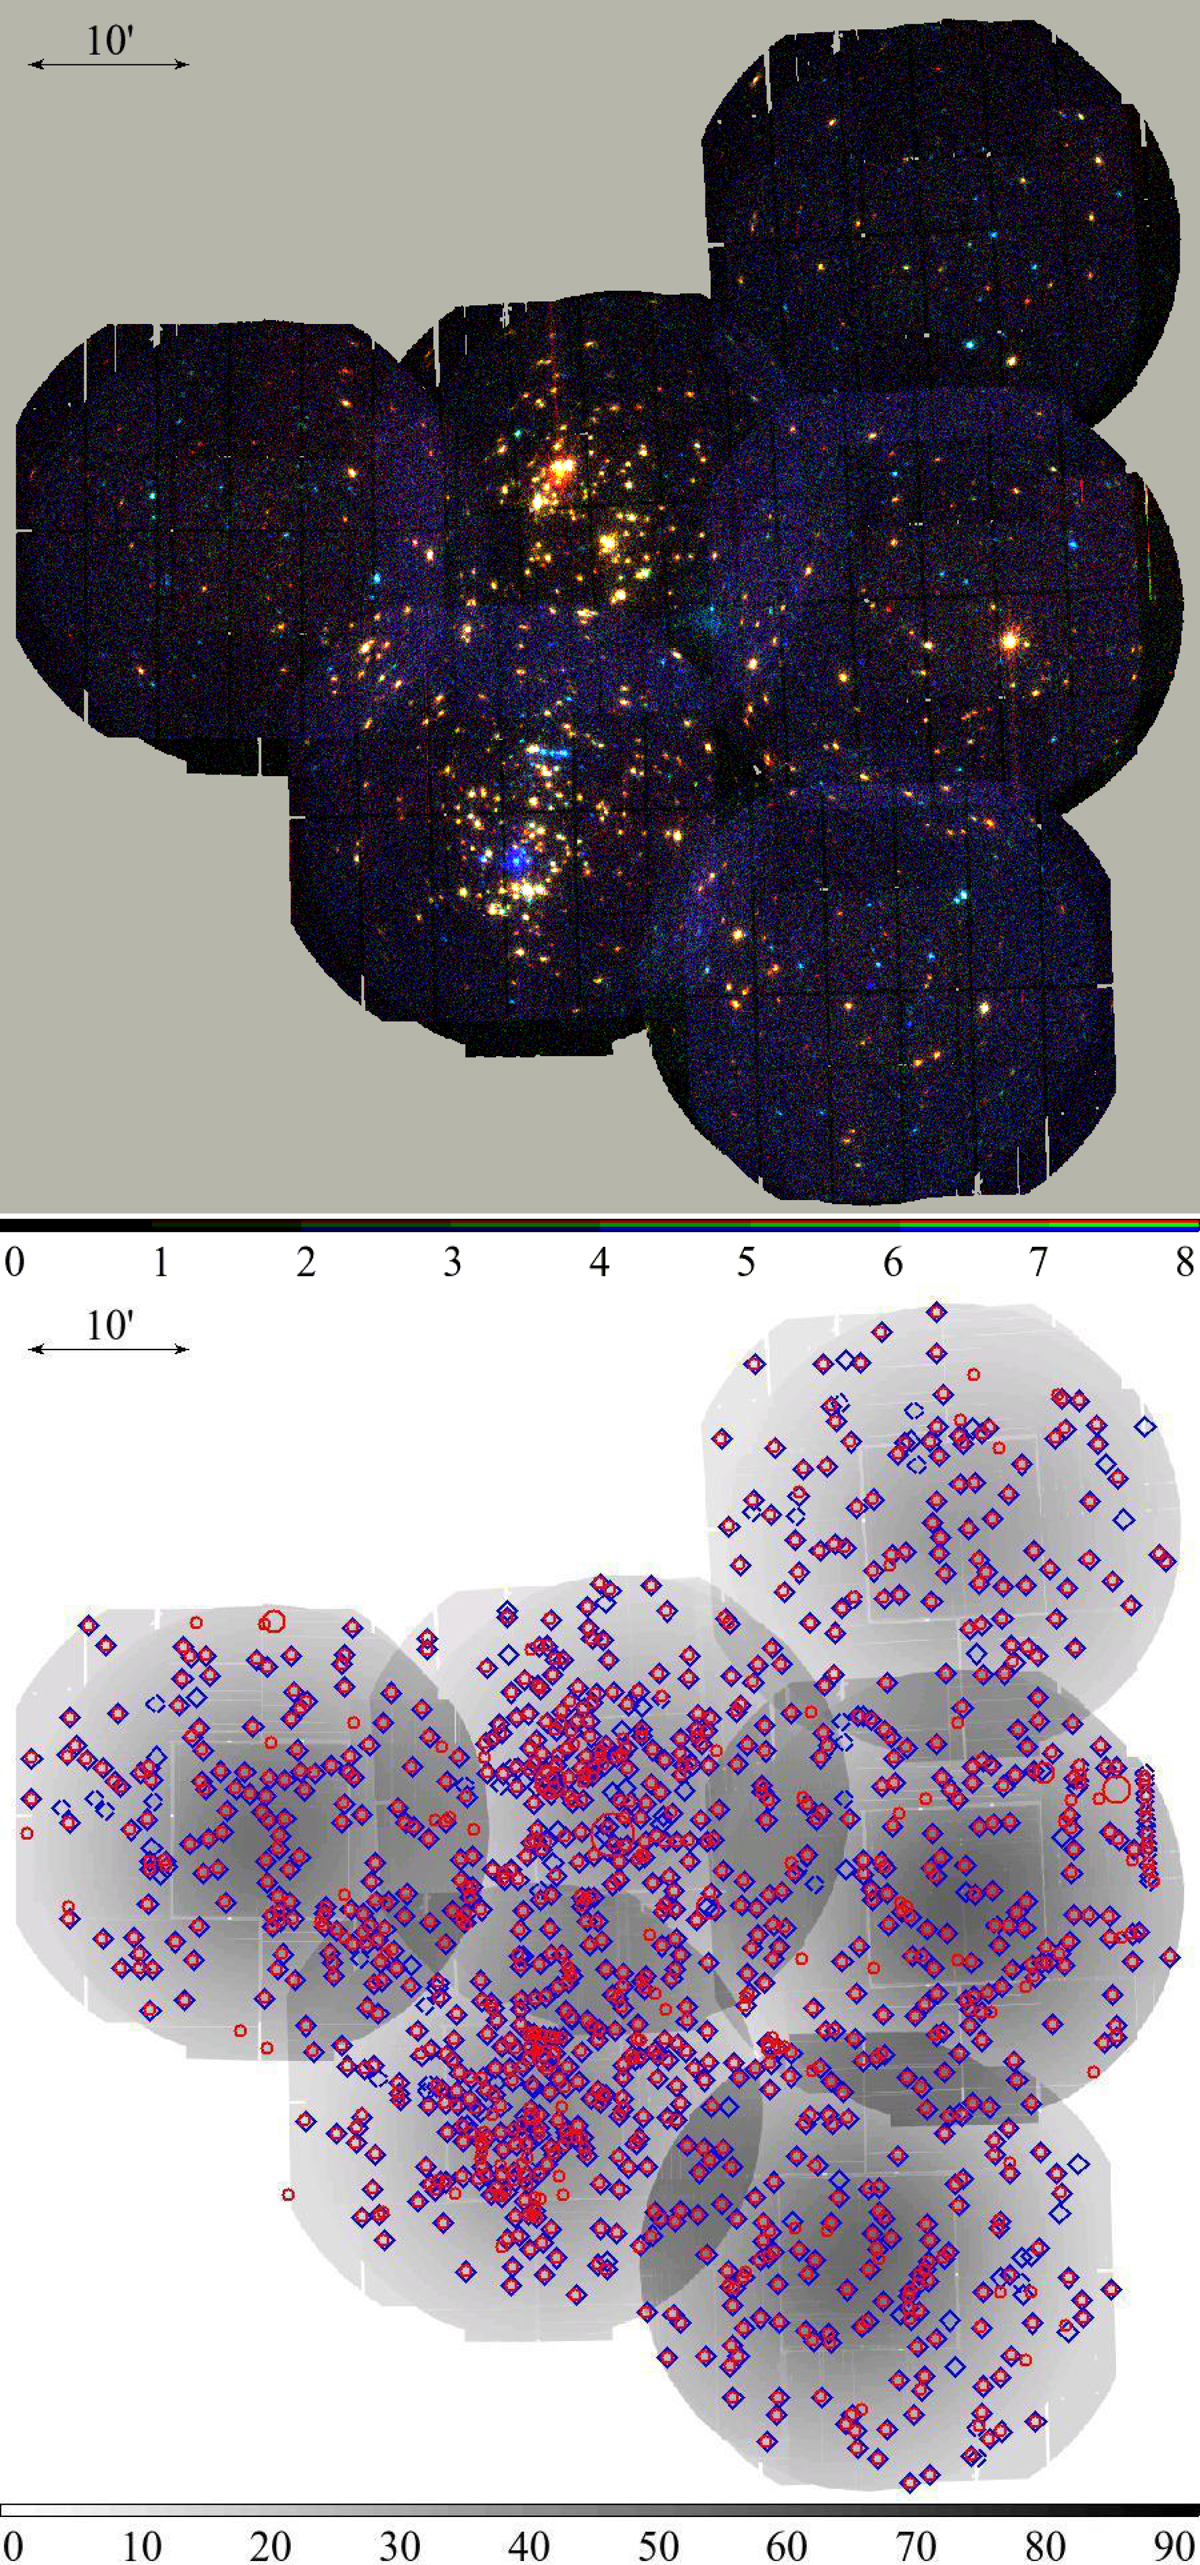
Example of a stack with six observations, targeting the star cluster NGC 2264. Upper panel: false-colour image in three energy bands 0.2 − 1.0, 1.0 − 2.0, and 2.0 − 12.0 keV to illustrate the different flux maxima of the detected objects. Lower panel: exposure map, giving the total exposure in ks, taking vignetting into account, with 4XMM-DR9s sources as red circles and 4XMM-DR9 sources as blue diamonds. The symbol size scales with the core radius of the extent model. Several low-quality (flagged) DR9 detections were not recovered in DR9s.
Current usage metrics show cumulative count of Article Views (full-text article views including HTML views, PDF and ePub downloads, according to the available data) and Abstracts Views on Vision4Press platform.
Data correspond to usage on the plateform after 2015. The current usage metrics is available 48-96 hours after online publication and is updated daily on week days.
Initial download of the metrics may take a while.