Free Access
Fig. 3.
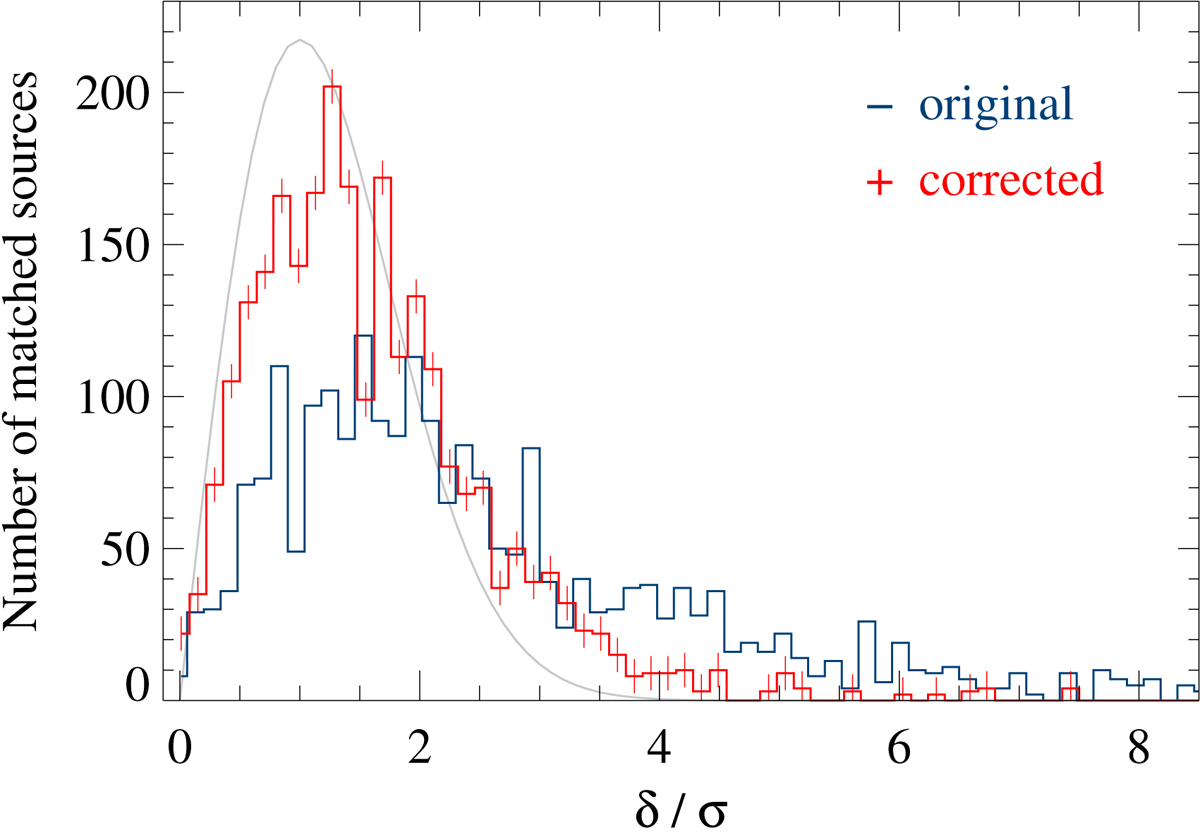
Distribution of the angular distances, given in units of the statistical error, between X-ray and optical SDSS positions before (blue) and after (red) event-based field rectification in a test sample of 25 stacks. The grey curve shows an ideal Rayleigh distribution.
Current usage metrics show cumulative count of Article Views (full-text article views including HTML views, PDF and ePub downloads, according to the available data) and Abstracts Views on Vision4Press platform.
Data correspond to usage on the plateform after 2015. The current usage metrics is available 48-96 hours after online publication and is updated daily on week days.
Initial download of the metrics may take a while.