Fig. 16.
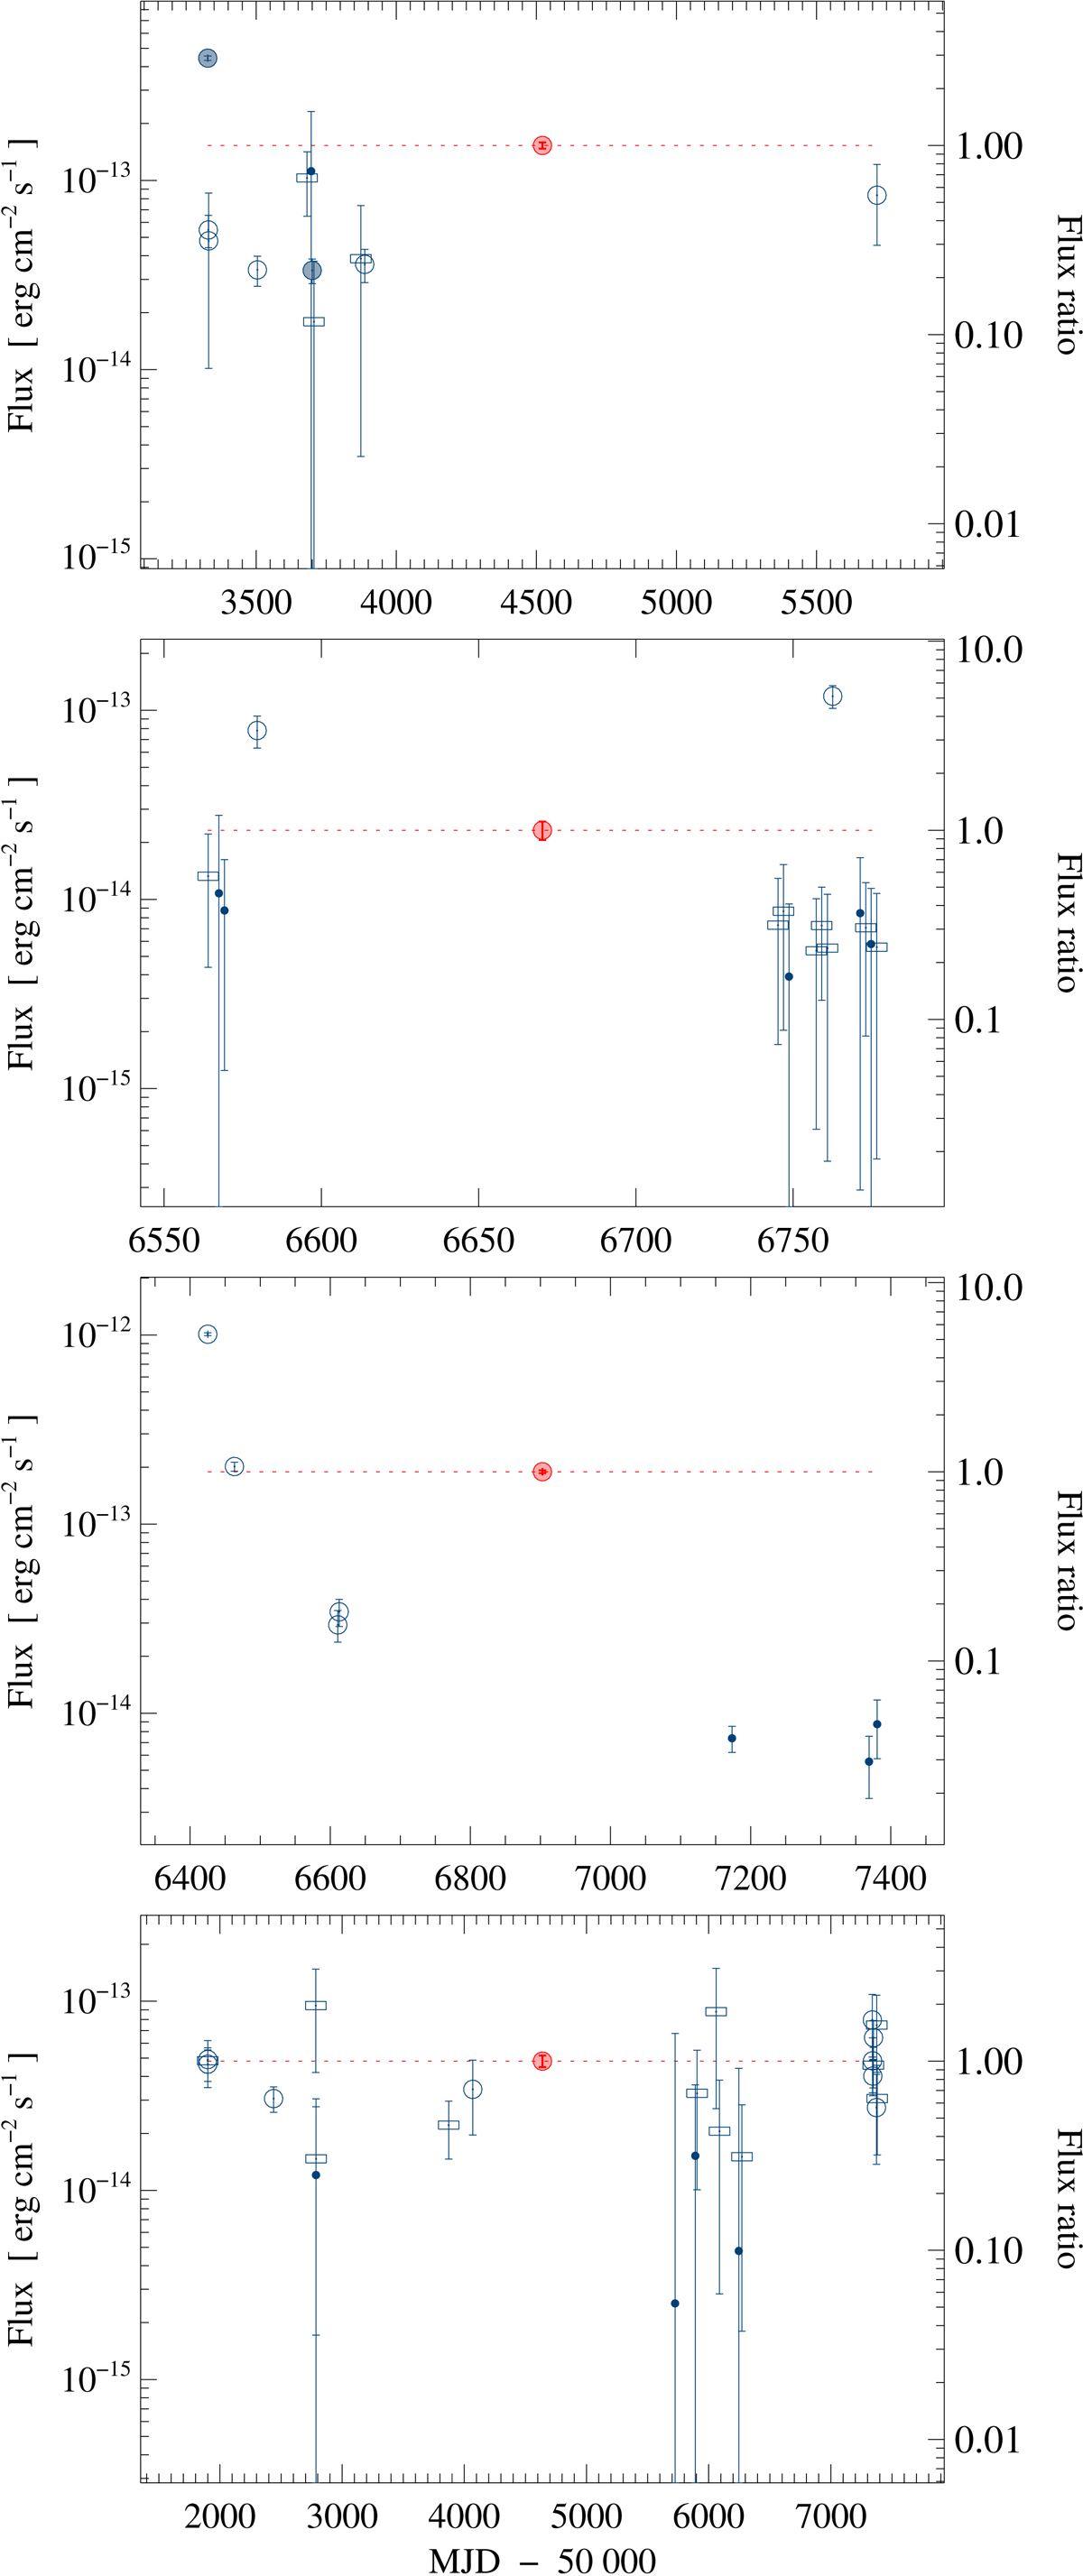
Example long-term light curves of variable sources in 4XMM-DR9s. Red: mean all-EPIC flux and flux error. Blue: observation-level fluxes. The plot symbols code the variability. Information on short-term variability within an observation is inherited from 4XMM-DR9. Filled circle: variability. Open circle: no variability. Box: short-term variability unknown. Dot: non-detection in 4XMM-DR9. From top to bottom: flaring M dwarf, star of unknown optical variability, gamma-ray burst afterglow, which became undetectable in single XMM-Newton observations after about two years, and a quasar.
Current usage metrics show cumulative count of Article Views (full-text article views including HTML views, PDF and ePub downloads, according to the available data) and Abstracts Views on Vision4Press platform.
Data correspond to usage on the plateform after 2015. The current usage metrics is available 48-96 hours after online publication and is updated daily on week days.
Initial download of the metrics may take a while.