Free Access
Fig. 14.
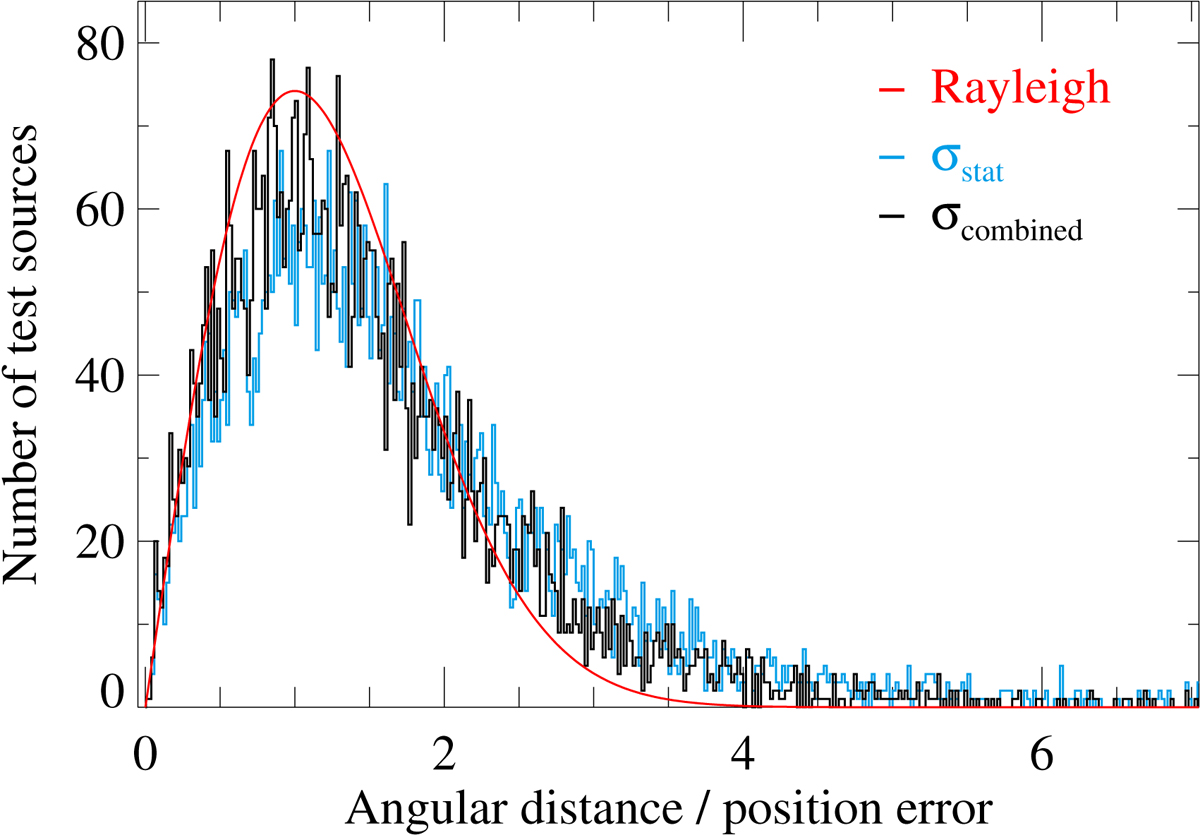
Error-normalised position offsets between 4XMM-DR9s and 6118 SDSS-selected quasars compared to an ideal Rayleigh distribution (red). The histograms show the distributions for the pure statistical position error σstat (blue) and for σcombined (black) which includes the additional error component σadd = 0.227″.
Current usage metrics show cumulative count of Article Views (full-text article views including HTML views, PDF and ePub downloads, according to the available data) and Abstracts Views on Vision4Press platform.
Data correspond to usage on the plateform after 2015. The current usage metrics is available 48-96 hours after online publication and is updated daily on week days.
Initial download of the metrics may take a while.