Fig. 13.
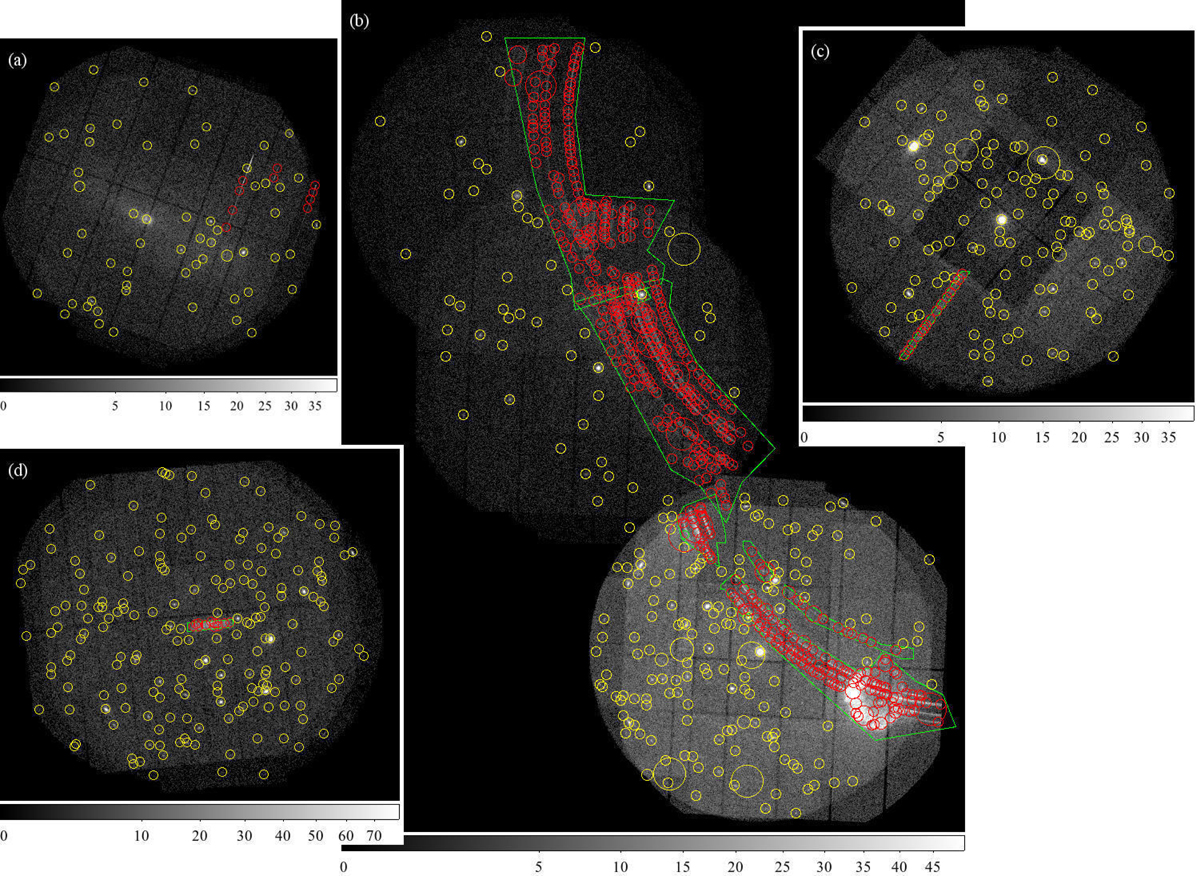
Examples from the manual screening process: bad detector features (panel a), single-reflection patterns (panel b), RGA diffraction pattern (panel c), path of a planet in a mosaic-mode observation (panel d). Yellow circles show all detections, where large radii correspond to the core radius of extended sources. Bad regions or detections are marked manually (green). The detections within them (red) are then flagged in the catalogue.
Current usage metrics show cumulative count of Article Views (full-text article views including HTML views, PDF and ePub downloads, according to the available data) and Abstracts Views on Vision4Press platform.
Data correspond to usage on the plateform after 2015. The current usage metrics is available 48-96 hours after online publication and is updated daily on week days.
Initial download of the metrics may take a while.