Fig. 1.
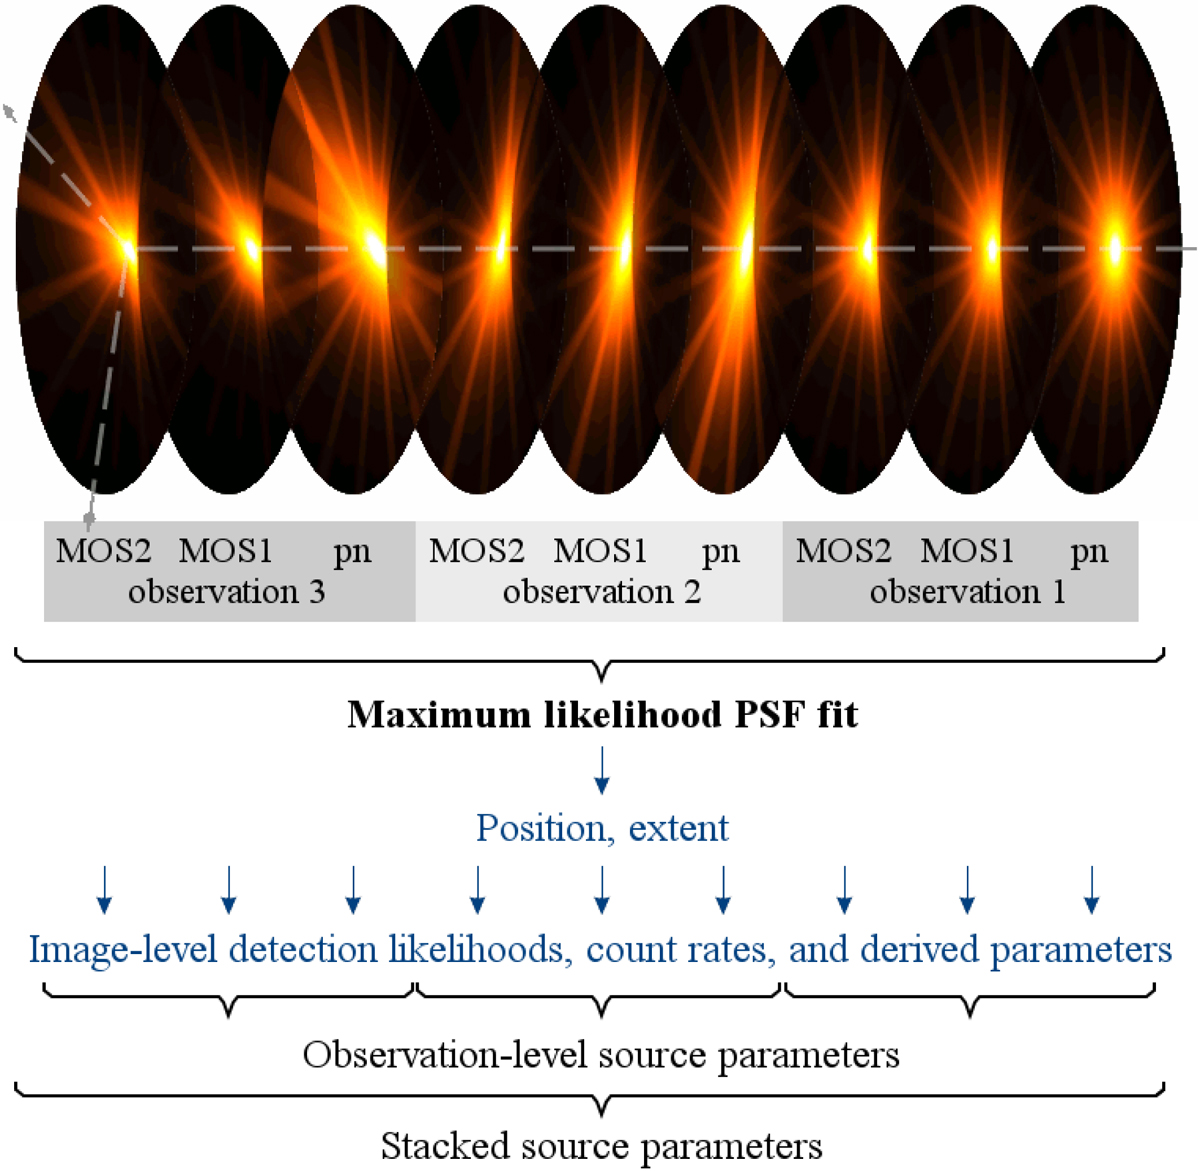
Illustration of the PSF shapes in the three EPIC instruments at different off-axis and azimuth angles in overlapping observations and of the parameter determination in the simultaneous maximum-likelihood PSF fit. The normalised PSFs – shown here for 1 keV in a linear intensity scale – are scaled to the count rate in the respective image within the detection fit. Position and extent of a source are the same in all observations, while the count rates are fitted in each image. Observation-level and stacked parameters are derived from the parameters of the contributing images (Traulsen et al. 2019).
Current usage metrics show cumulative count of Article Views (full-text article views including HTML views, PDF and ePub downloads, according to the available data) and Abstracts Views on Vision4Press platform.
Data correspond to usage on the plateform after 2015. The current usage metrics is available 48-96 hours after online publication and is updated daily on week days.
Initial download of the metrics may take a while.