Fig. 6
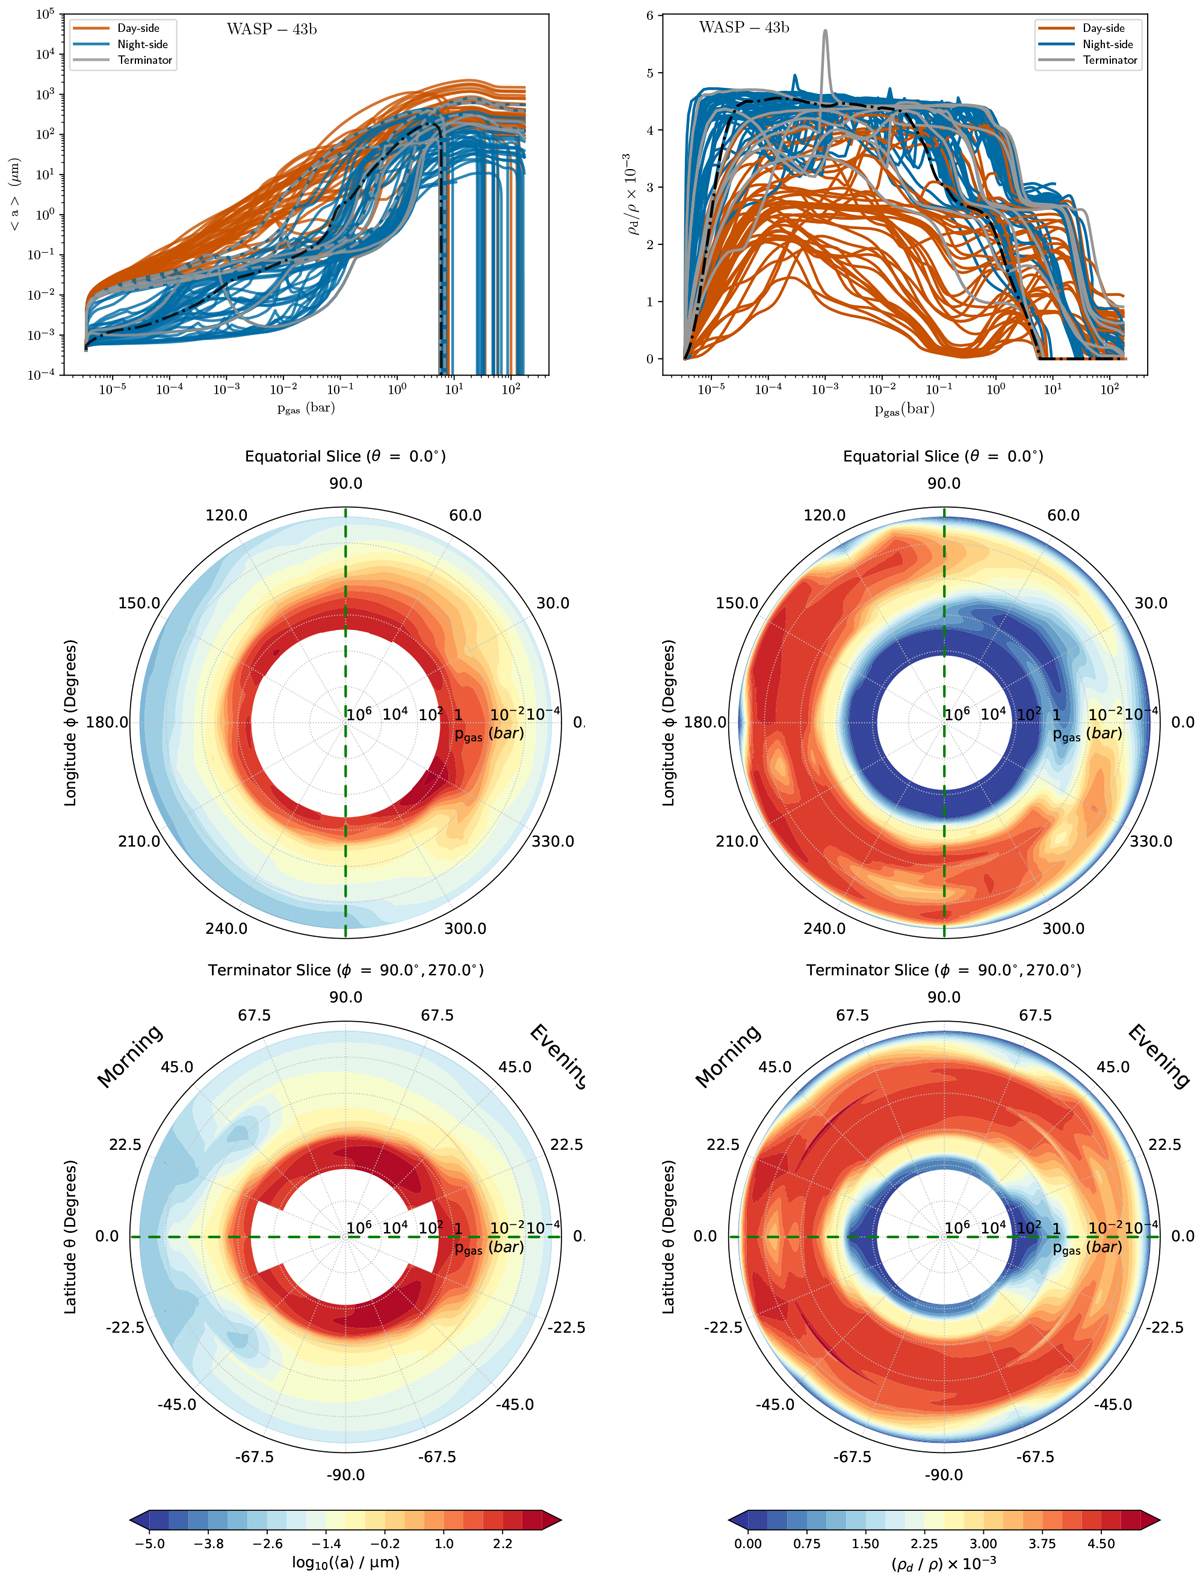
Left: mean cloud particle size ⟨a⟩ [μm]. Right: cloud particle load in terms of dust-to-gas mass ratios, ρd∕ρgas [10−3]. Top: for all1D trajectories. The nightside profiles are shown in blue, the dayside profiles in orange, the terminator profiles in grey. Middle: 2D cut visualising the spatial location in the equatorial plane. Bottom: 2D cut along the terminator for a tidally locked WASP-43b.
Current usage metrics show cumulative count of Article Views (full-text article views including HTML views, PDF and ePub downloads, according to the available data) and Abstracts Views on Vision4Press platform.
Data correspond to usage on the plateform after 2015. The current usage metrics is available 48-96 hours after online publication and is updated daily on week days.
Initial download of the metrics may take a while.