Fig. 2
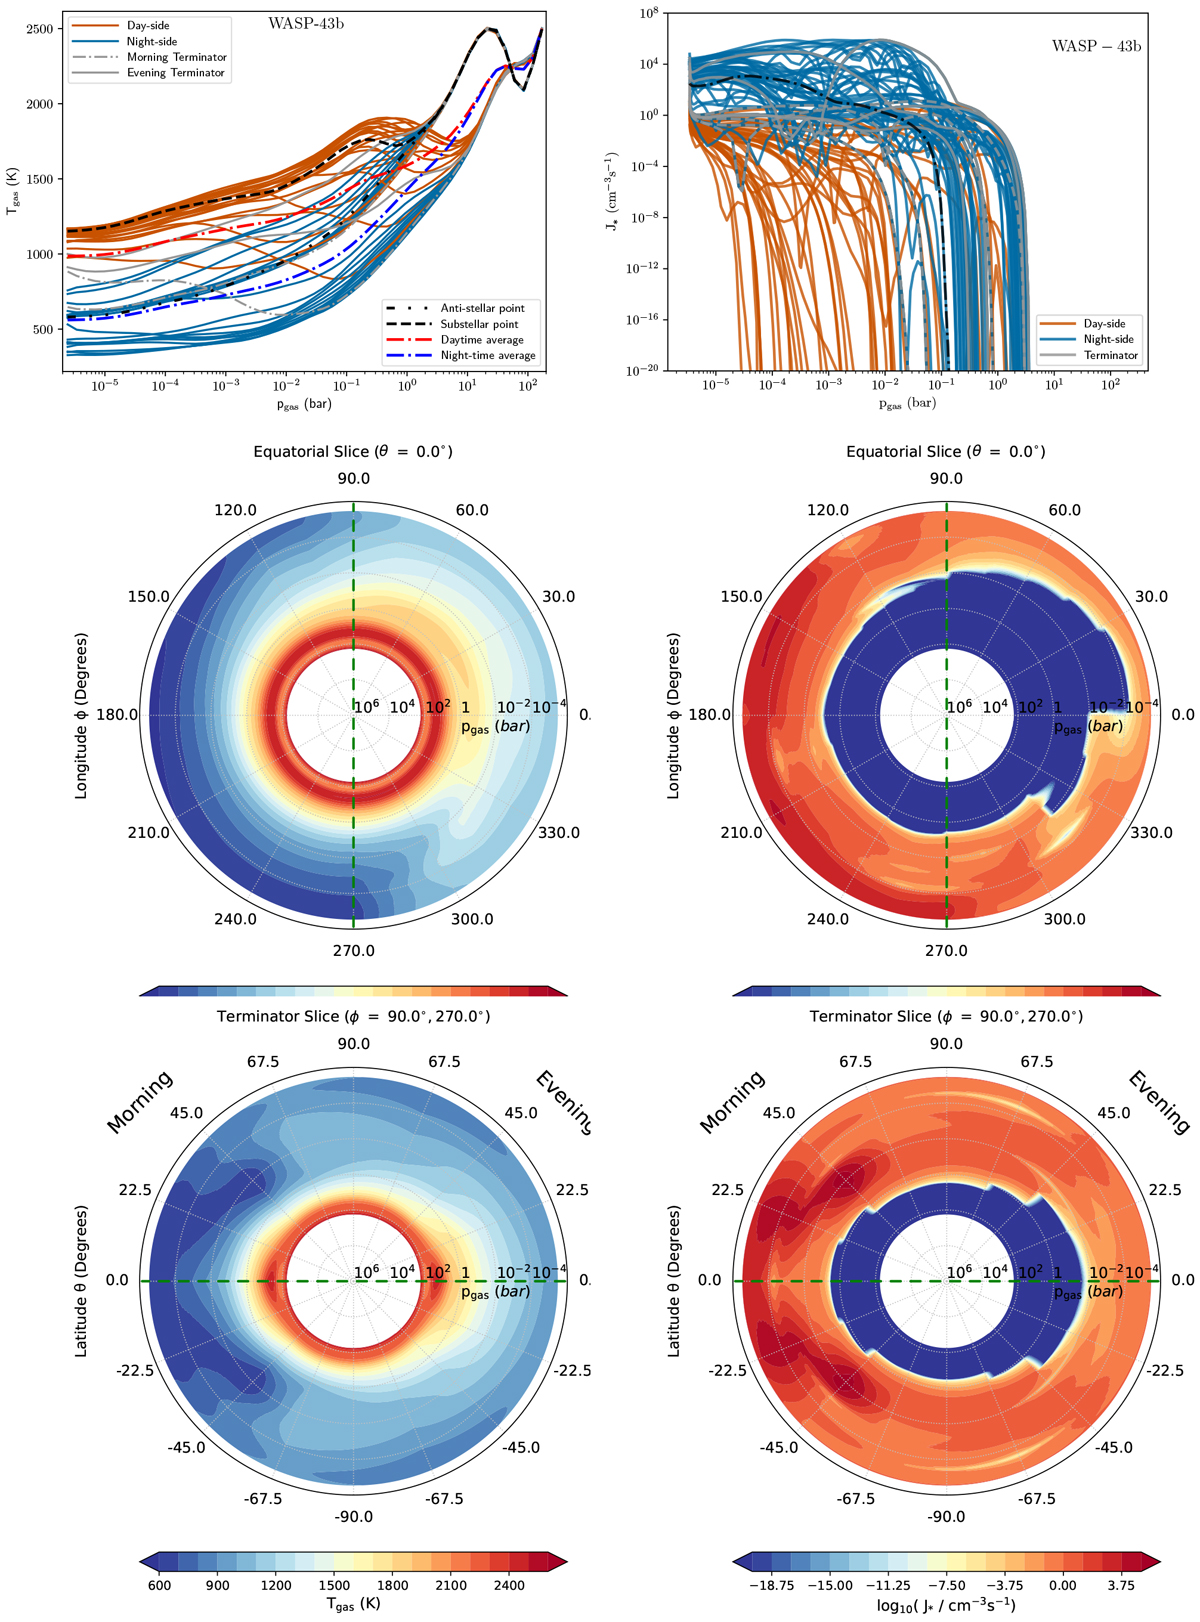
Left: local gas temperature and local gas pressure (Tgas, pgas) extracted from the 3D GCM (Parmentier et al. 2018). Right: total mineral seed formation (nucleation) rate, J* [cm−3 s−1]. Top: 1D profiles for the probed 97 profiles (red – dayside, blue - nightside, grey dashed – morning terminator (ϕ = 270°), grey-solid – evening terminator (ϕ = 90°), black dashed– substellar point(ϕ = 0°) black dot-dashed – antistellar point (ϕ = 180°)). Middle: 2D cut visualising the temperature distribution (left) and the distribution of the formed condensation seeds (right) in the equatorial plane. Bottom: 2D cut along the terminator for the a tidally locked WASP-43b.
Current usage metrics show cumulative count of Article Views (full-text article views including HTML views, PDF and ePub downloads, according to the available data) and Abstracts Views on Vision4Press platform.
Data correspond to usage on the plateform after 2015. The current usage metrics is available 48-96 hours after online publication and is updated daily on week days.
Initial download of the metrics may take a while.