Fig. 11
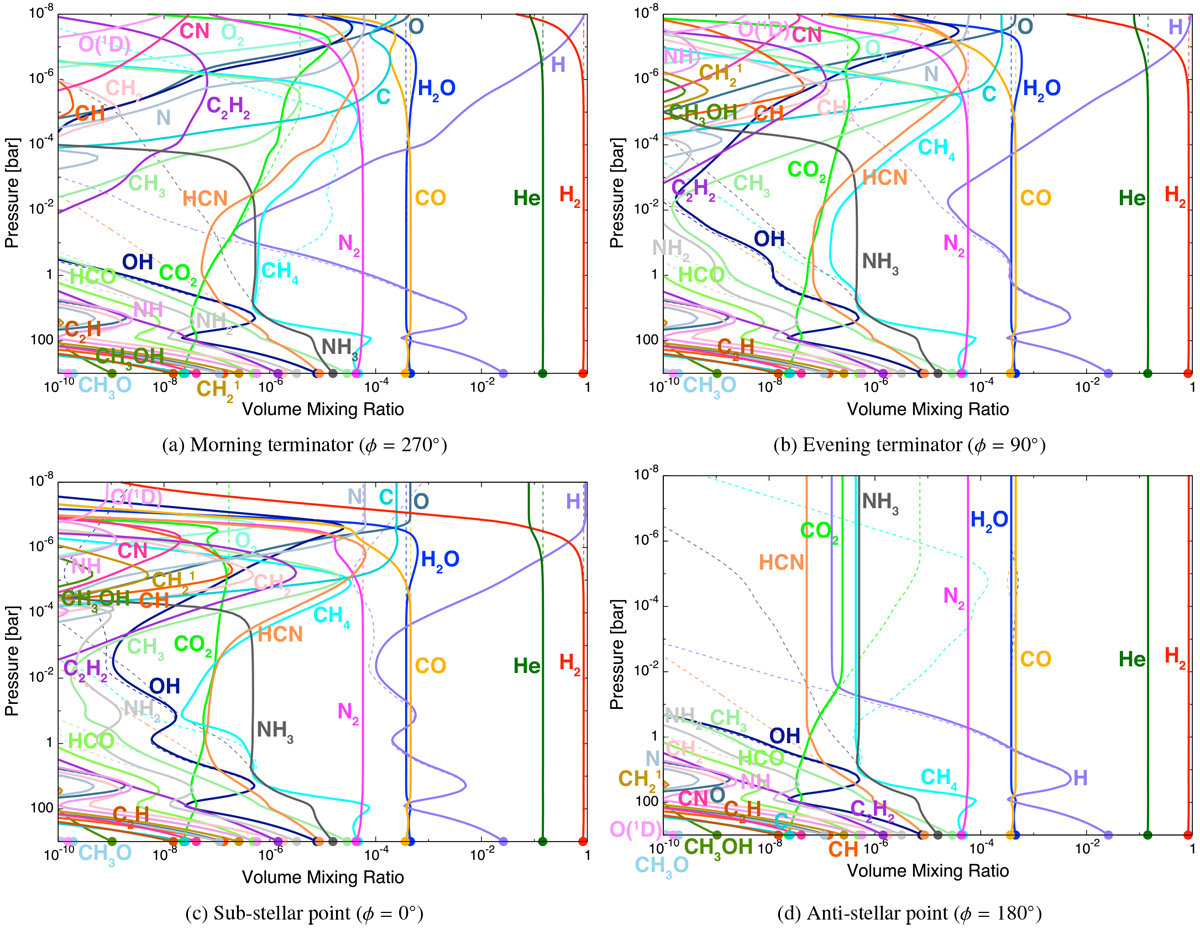
Kinetic photochemical equilibrium C/H/O/N gas-phase results (solid line) for the 1D WASP-43b profiles at (a) the morning terminator (ϕ = 270°), (b) the evening terminator (ϕ = 90°), (c) the sub-stellar point (ϕ = 0°) and (d) the anti-stellar point (ϕ = 180°). The filled circles represent the thermochemical equilibrium values at the lower boundary. For reference, the dashed lines show the abundances in thermochemical equilibrium, where the eddy diffusion transport is also ignored.
Current usage metrics show cumulative count of Article Views (full-text article views including HTML views, PDF and ePub downloads, according to the available data) and Abstracts Views on Vision4Press platform.
Data correspond to usage on the plateform after 2015. The current usage metrics is available 48-96 hours after online publication and is updated daily on week days.
Initial download of the metrics may take a while.