Fig. 8
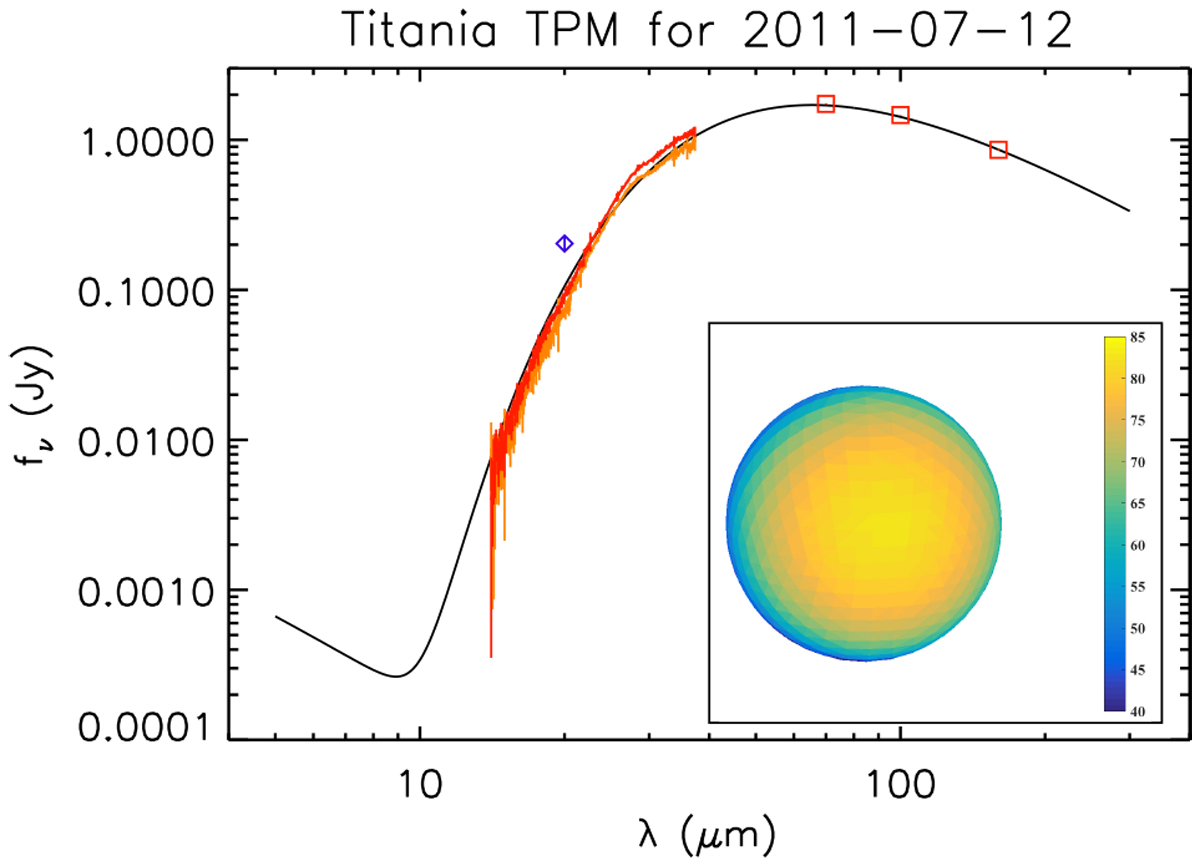
Thermophysical model of Titania between 5 and 300 μm (black line) for the second epoch (2011-07-12). Photometric measurements are PACS observations (red boxes), the IRTF observation (blue diamond) and the Spitzer-IRS CASSIS data (orange spectrum: leading hemisphere observation; red spectrum: trailing hemisphere data). For an explanation of the IRTF and IRS data re-scale, see text and caption of Fig. 7. The insert shows the resulting TPM surface temperature map of Titania for the range 40–85 K.
Current usage metrics show cumulative count of Article Views (full-text article views including HTML views, PDF and ePub downloads, according to the available data) and Abstracts Views on Vision4Press platform.
Data correspond to usage on the plateform after 2015. The current usage metrics is available 48-96 hours after online publication and is updated daily on week days.
Initial download of the metrics may take a while.