Fig. 7
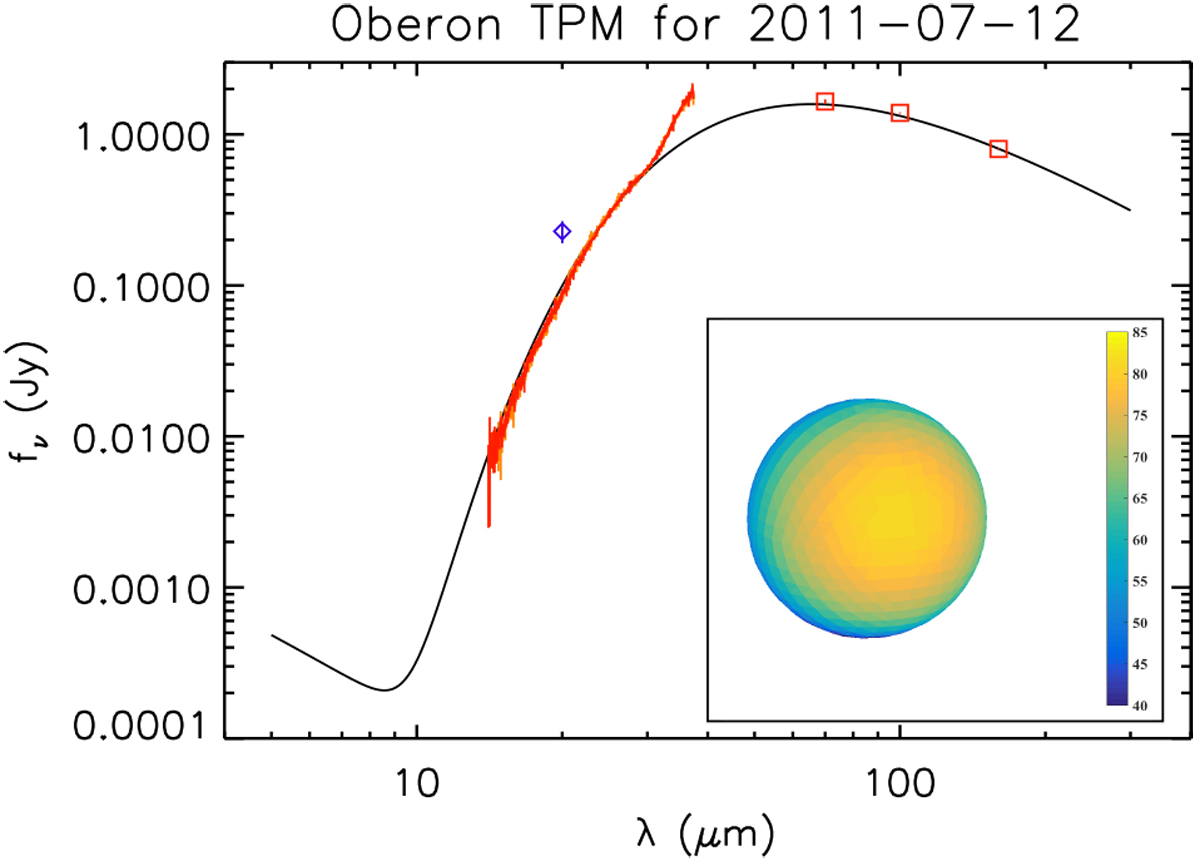
Thermophysical model of Oberon between 5 and 300 μm (black line) for the second epoch (2011-07-12). Photometric measurements are PACS observations (red boxes), the IRTF observation (blue diamond), and the Spitzer-IRS CASSIS data (orange spectrum: leading hemisphere observation;red spectrum: trailing hemisphere data). The CASSIS spectra suffer from Uranus stray light longward of 30 μm. The IRTF and IRS data were re-scaled to the model epoch with ![]() . Nevertheless, the IRTF flux appears to be too high with regard to the model, because the IRTF measurement was done under close to pole-on illumination, when the moon was hotter, while the model reflects more a viewing geometry close to equator-on, when the moon was colder due to heat transport to the night side. The insert shows the resulting TPM surface temperature map of Oberon for the range 40–85 K.
. Nevertheless, the IRTF flux appears to be too high with regard to the model, because the IRTF measurement was done under close to pole-on illumination, when the moon was hotter, while the model reflects more a viewing geometry close to equator-on, when the moon was colder due to heat transport to the night side. The insert shows the resulting TPM surface temperature map of Oberon for the range 40–85 K.
Current usage metrics show cumulative count of Article Views (full-text article views including HTML views, PDF and ePub downloads, according to the available data) and Abstracts Views on Vision4Press platform.
Data correspond to usage on the plateform after 2015. The current usage metrics is available 48-96 hours after online publication and is updated daily on week days.
Initial download of the metrics may take a while.