Fig. 5
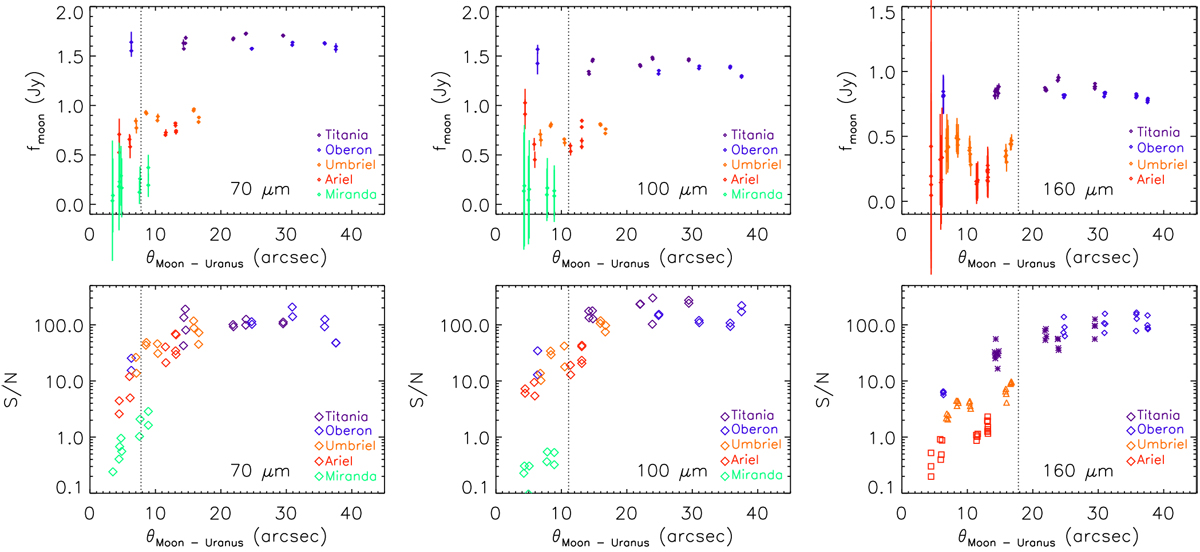
Upper panel: derived fluxes fmoon from PSF photometry and their uncertainties σtot depending on the distance of the Uranian moon from the Uranus position for the 70, 100, and 160 μm filter, respectively. Lower panel: corresponding signal-to-noise ratios (S∕N
= ![]() ). The dashed vertical line at ≈7.′′8, 11.′′ 1, and 17.′′ 8, respectively (scaling with λc
of the filter) indicates a radius inside which the uncertainty increases and the S/N degrades noticeably due to PSF residuals.
). The dashed vertical line at ≈7.′′8, 11.′′ 1, and 17.′′ 8, respectively (scaling with λc
of the filter) indicates a radius inside which the uncertainty increases and the S/N degrades noticeably due to PSF residuals.
Current usage metrics show cumulative count of Article Views (full-text article views including HTML views, PDF and ePub downloads, according to the available data) and Abstracts Views on Vision4Press platform.
Data correspond to usage on the plateform after 2015. The current usage metrics is available 48-96 hours after online publication and is updated daily on week days.
Initial download of the metrics may take a while.