Fig. 2
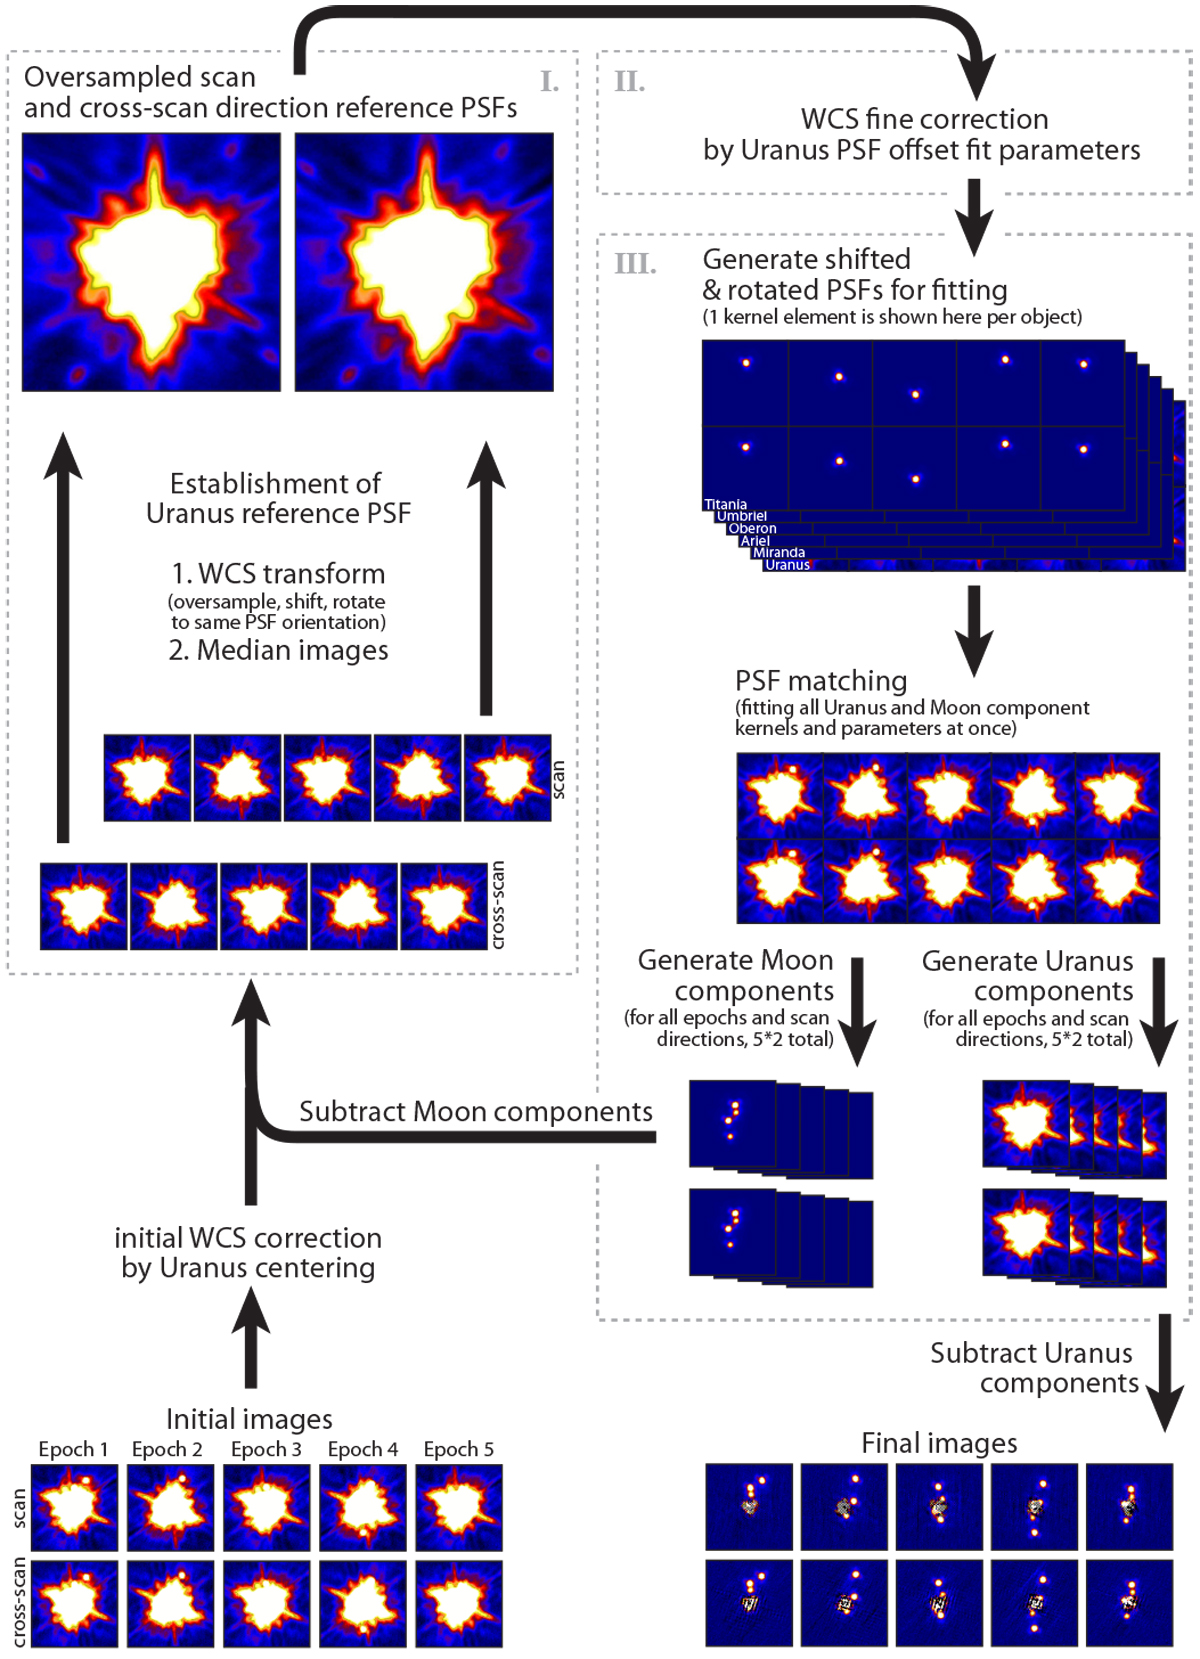
Flowchart for the iteration cycle. The dashed boxes show the three main parts of the iteration loop. The calculation starts at bottom left by initial WCS correction of the raw images. The iteration cycle is stopped when the fit parameters do not change significantly. The 25 iteration cycles were needed for each dataset with different HPF and pixfrac values and, of course, each filter. Finally, Uranus-subtracted images are at the bottom right.
Current usage metrics show cumulative count of Article Views (full-text article views including HTML views, PDF and ePub downloads, according to the available data) and Abstracts Views on Vision4Press platform.
Data correspond to usage on the plateform after 2015. The current usage metrics is available 48-96 hours after online publication and is updated daily on week days.
Initial download of the metrics may take a while.