Fig. 9
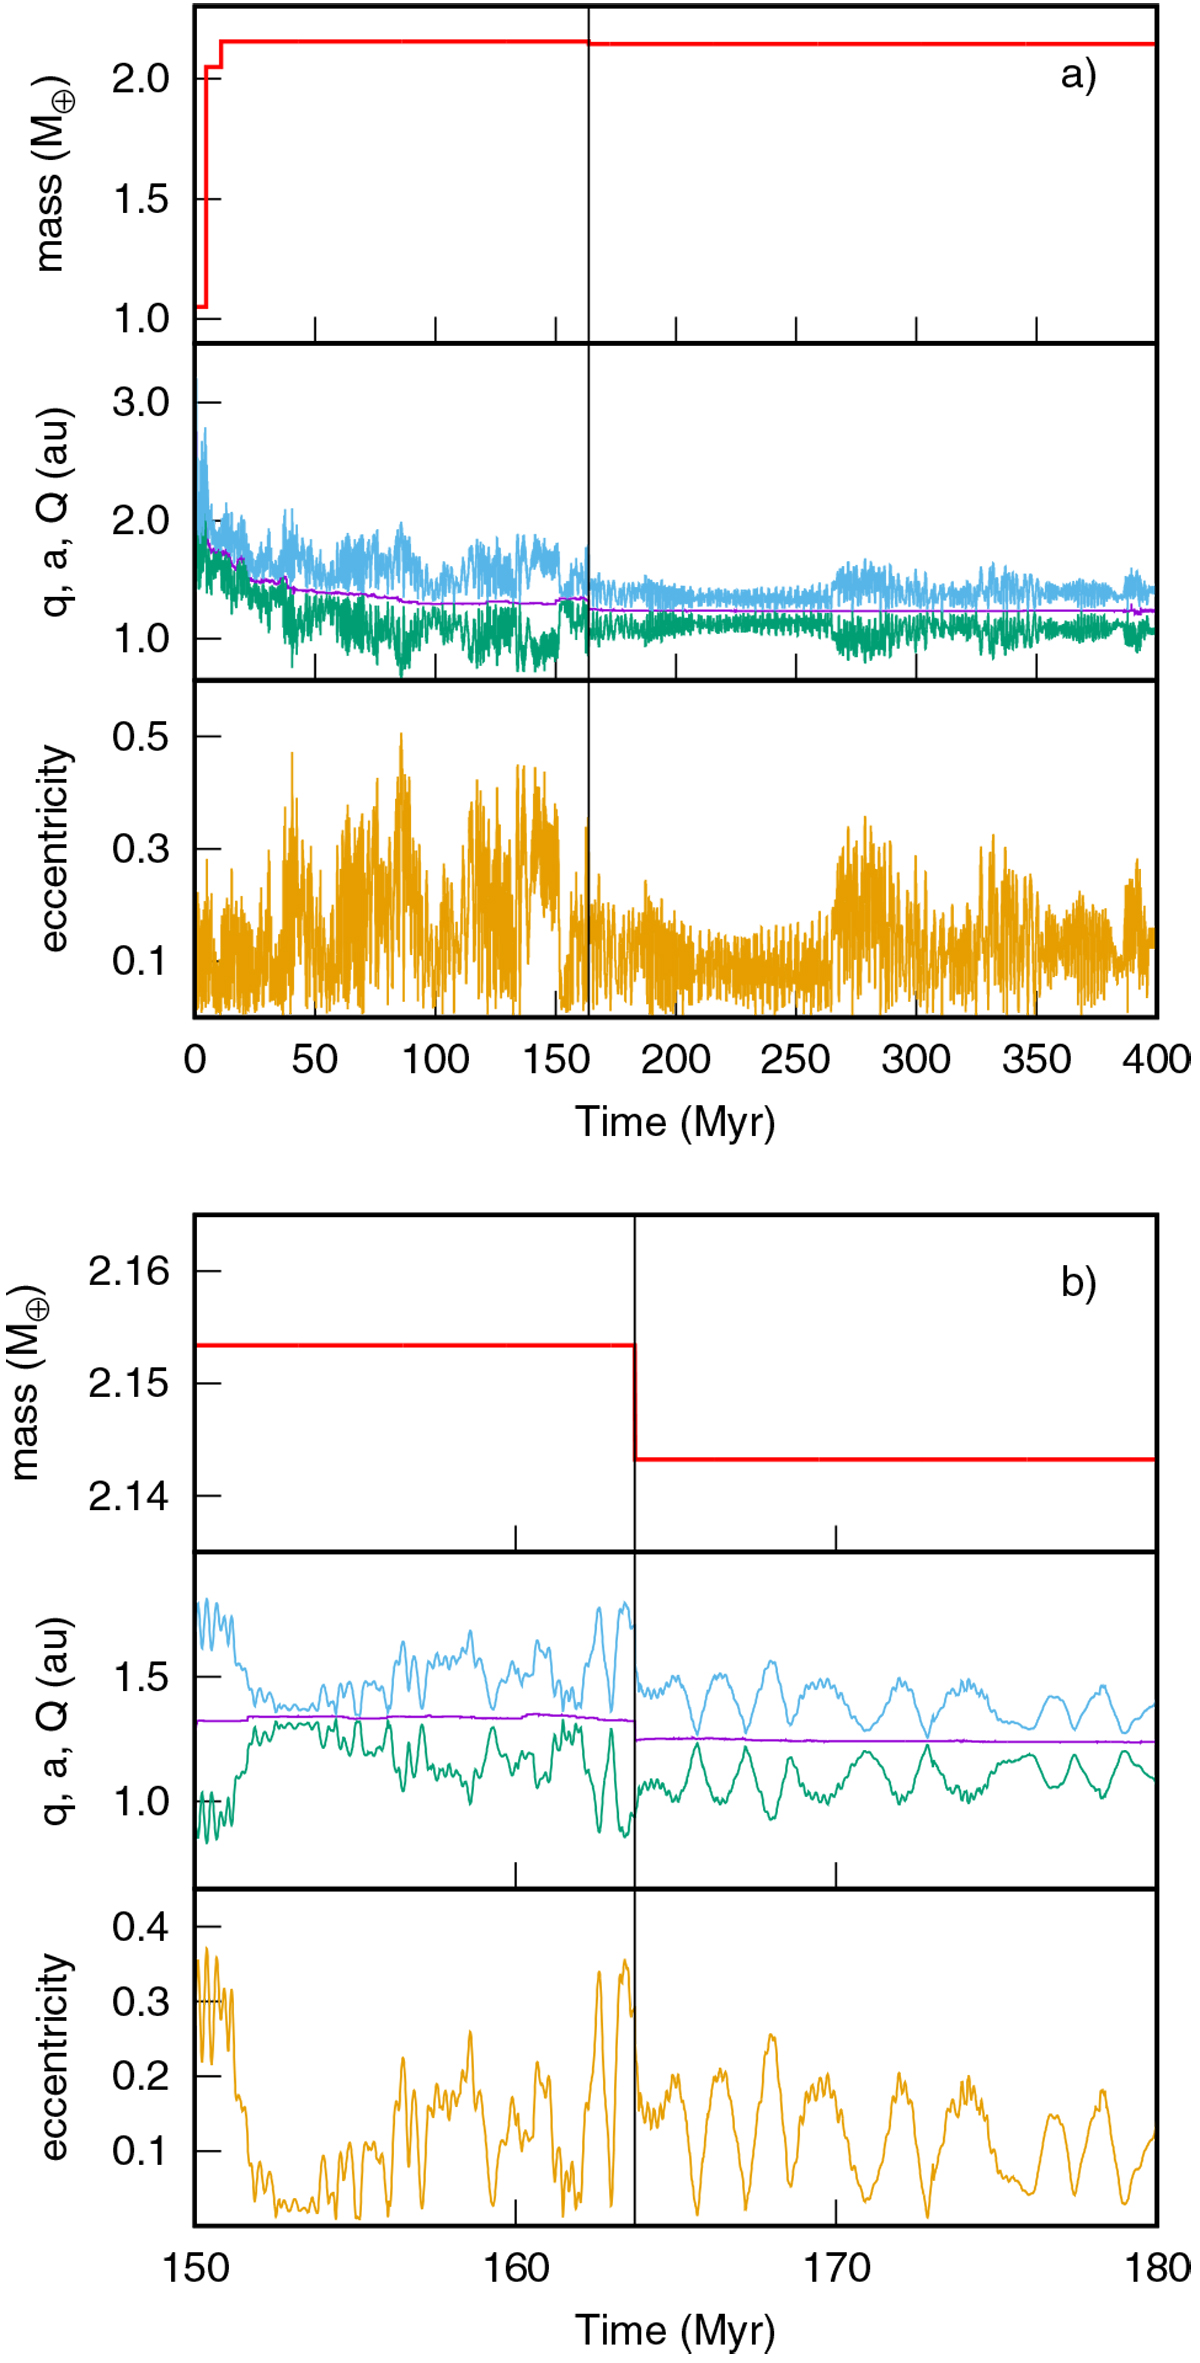
Physical and orbital evolution in time of a class B planet from set F1. Panel a, top panel: mass evolution. Middle panel: evolution of pericentric distance (q), semimajor axis (a), and apocentric distance (Q) with light blue, purple, and green traces, respectively. Bottom panel: evolution of eccentricity. Panel b: temporal magnification around the time corresponding to an erosive collision with a Mars-mass projectile. The color code is analogousto panel a. The black vertical line in both panels indicates when the planetary embryo suffered an erosive collision.
Current usage metrics show cumulative count of Article Views (full-text article views including HTML views, PDF and ePub downloads, according to the available data) and Abstracts Views on Vision4Press platform.
Data correspond to usage on the plateform after 2015. The current usage metrics is available 48-96 hours after online publication and is updated daily on week days.
Initial download of the metrics may take a while.