Fig. 4
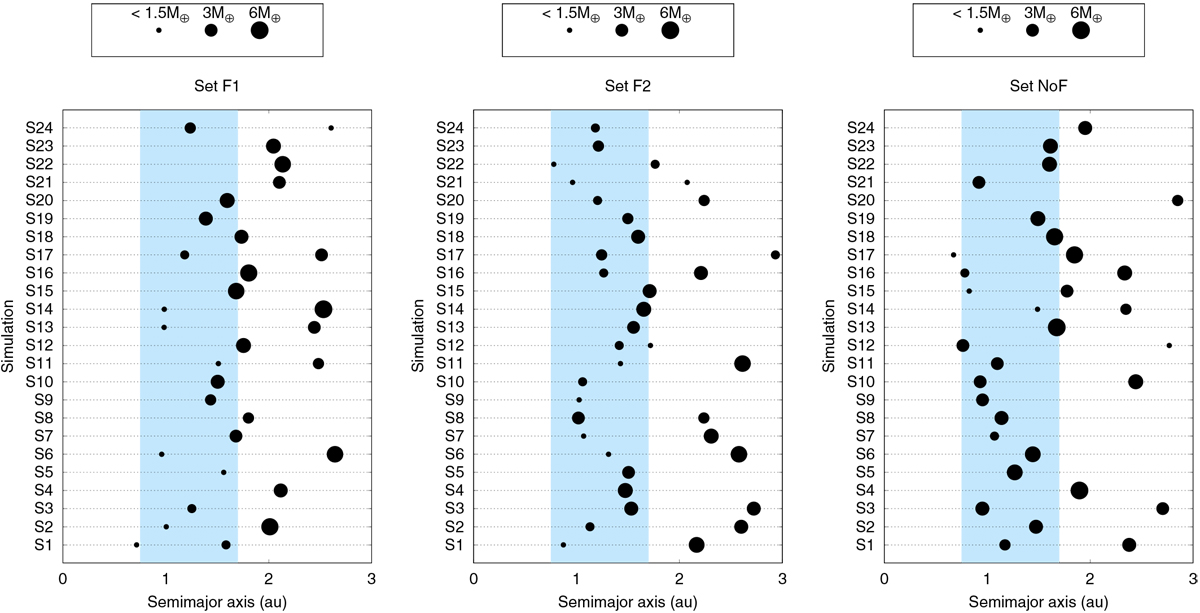
Planetary systems produced in the F1 (left panel), F2 (middle panel), and NoF (right panel) N-body simulations.The black circles represent the planets formed in the different numerical experiments, while each circle’s size scales with the planet’s mass, according to that indicated at the top of each panel. The sky-blue area illustrated in the differentpanels represents the HZ derived by Kopparapu et al. (2013).
Current usage metrics show cumulative count of Article Views (full-text article views including HTML views, PDF and ePub downloads, according to the available data) and Abstracts Views on Vision4Press platform.
Data correspond to usage on the plateform after 2015. The current usage metrics is available 48-96 hours after online publication and is updated daily on week days.
Initial download of the metrics may take a while.