Fig. 3
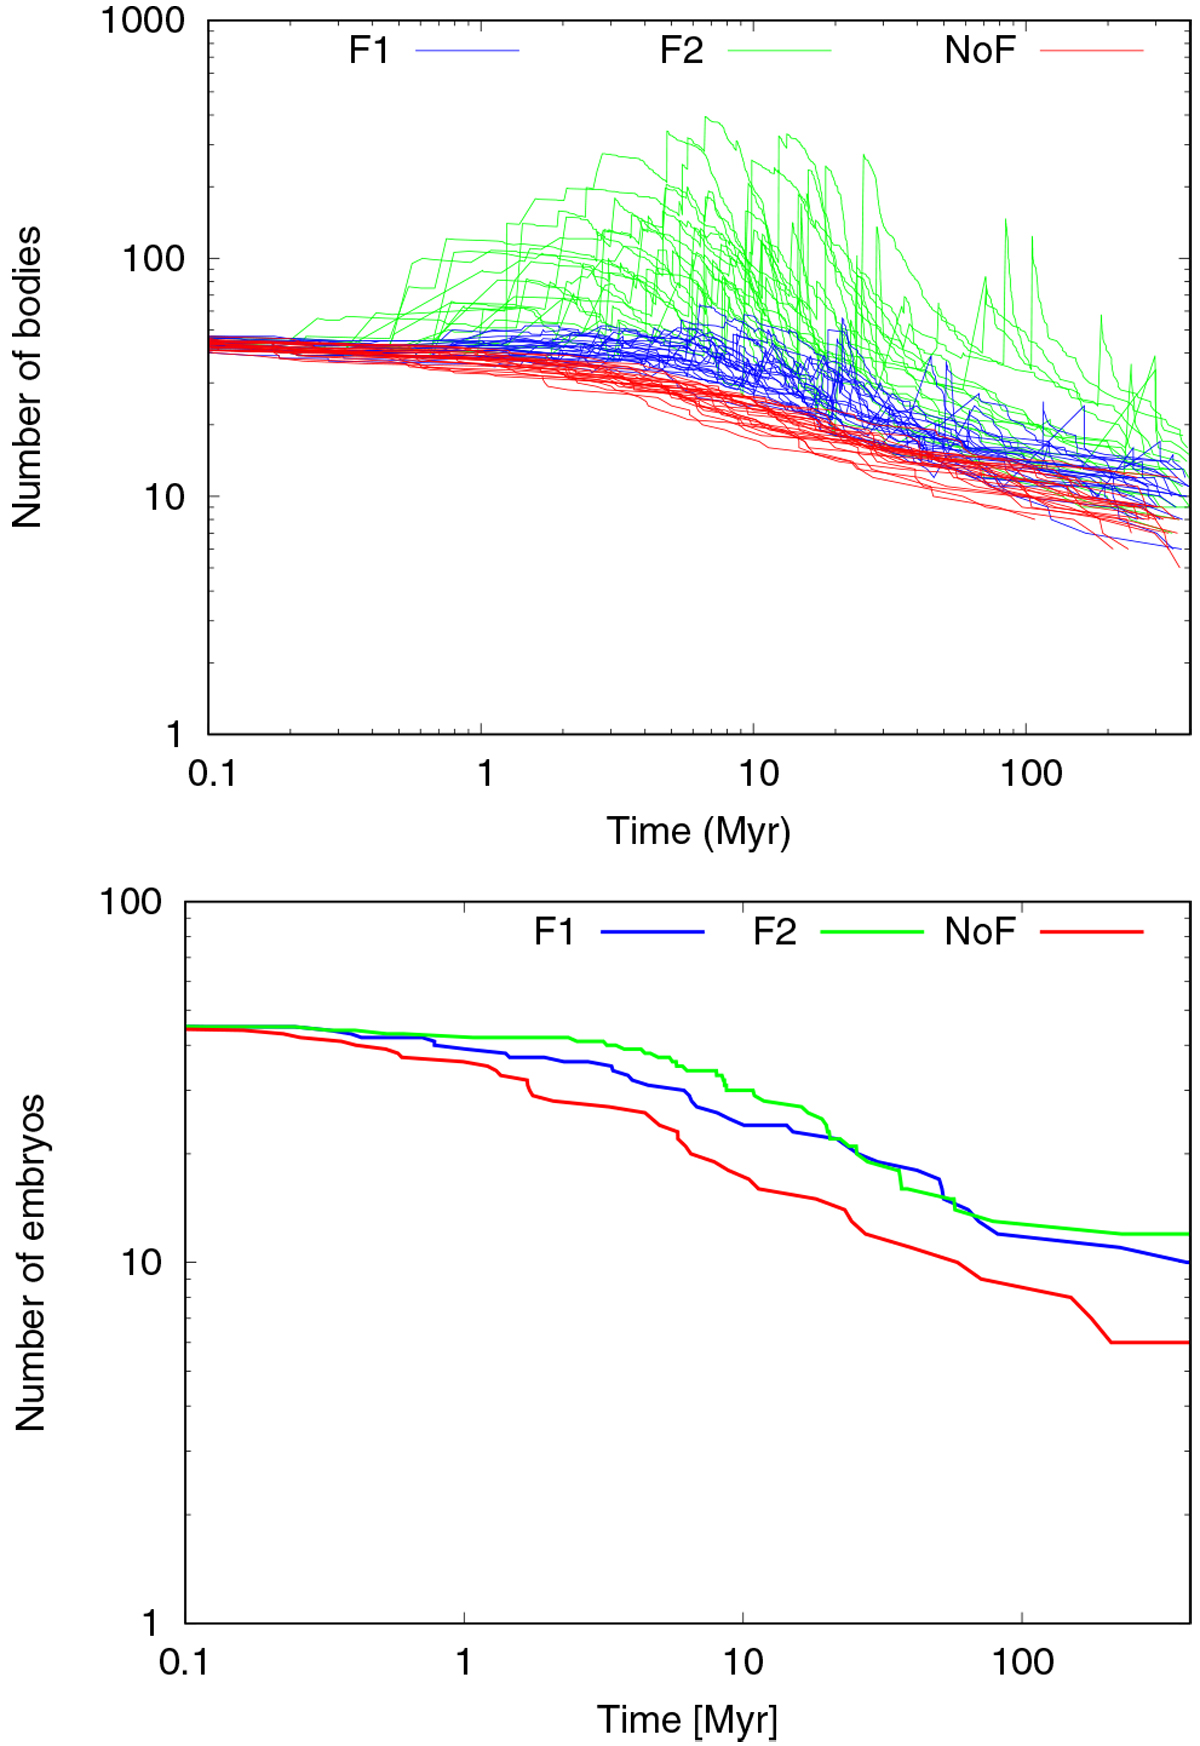
Time evolution for the number of bodies in sets F1, F2, and NoF, which are depicted with blue, green, and red traces, respectively. Top panel: generated considering both embryos and fragments in the system for all simulations. Bottom panel: analogous to the top panel, but only counting the number of embryos for a representative simulation.
Current usage metrics show cumulative count of Article Views (full-text article views including HTML views, PDF and ePub downloads, according to the available data) and Abstracts Views on Vision4Press platform.
Data correspond to usage on the plateform after 2015. The current usage metrics is available 48-96 hours after online publication and is updated daily on week days.
Initial download of the metrics may take a while.