Fig. 2
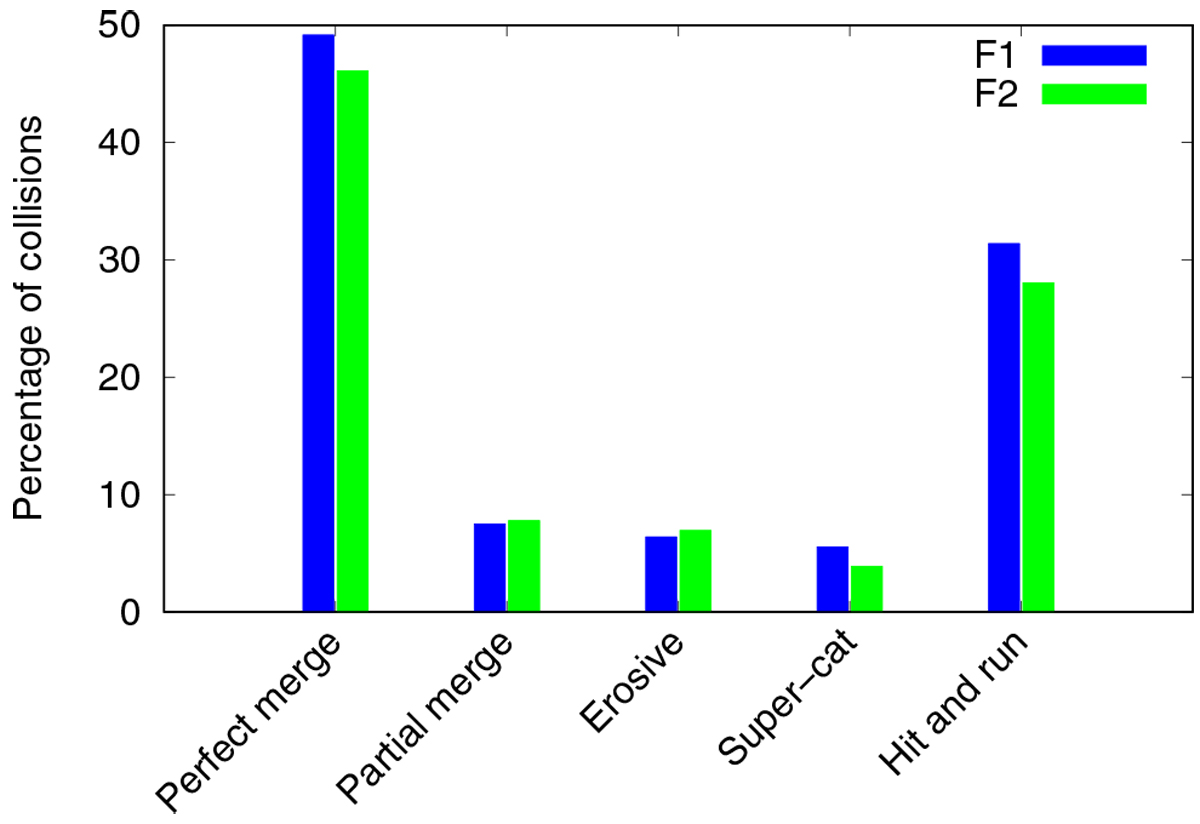
Comparative histogram for the different collision regimes and their respective percentages of occurrence for the F1 (blue bars) and F2 (green bars) scenarios. It is important to remark that the collisions considered to build these histograms included only giant impacts. In fact, the collisions between embryos and fragments are not accounted for.
Current usage metrics show cumulative count of Article Views (full-text article views including HTML views, PDF and ePub downloads, according to the available data) and Abstracts Views on Vision4Press platform.
Data correspond to usage on the plateform after 2015. The current usage metrics is available 48-96 hours after online publication and is updated daily on week days.
Initial download of the metrics may take a while.