Fig. 1
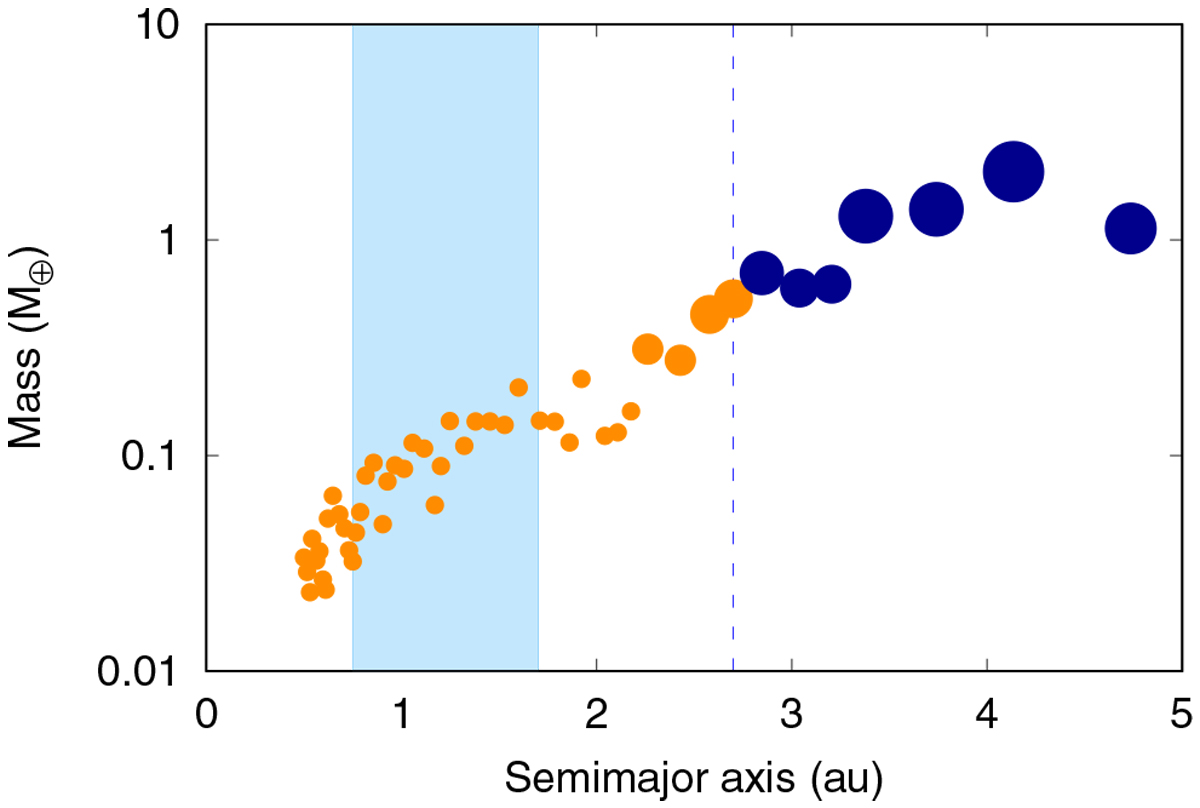
Mass distribution of planetary embryos from one representative simulation as a function of the initial semimajor axis at the end of the gaseous phase. The size of the circles is scaled with the mass of each embryo. The color code refers to the initial fraction of water by mass of the embryos. The orange (dark blue) circles indicate a fraction of 10−4 (0.5) of water by mass. The sky-blue shaded region illustrates the HZ of the system, while the dashed blue line represents the snow line assumed in our model.
Current usage metrics show cumulative count of Article Views (full-text article views including HTML views, PDF and ePub downloads, according to the available data) and Abstracts Views on Vision4Press platform.
Data correspond to usage on the plateform after 2015. The current usage metrics is available 48-96 hours after online publication and is updated daily on week days.
Initial download of the metrics may take a while.