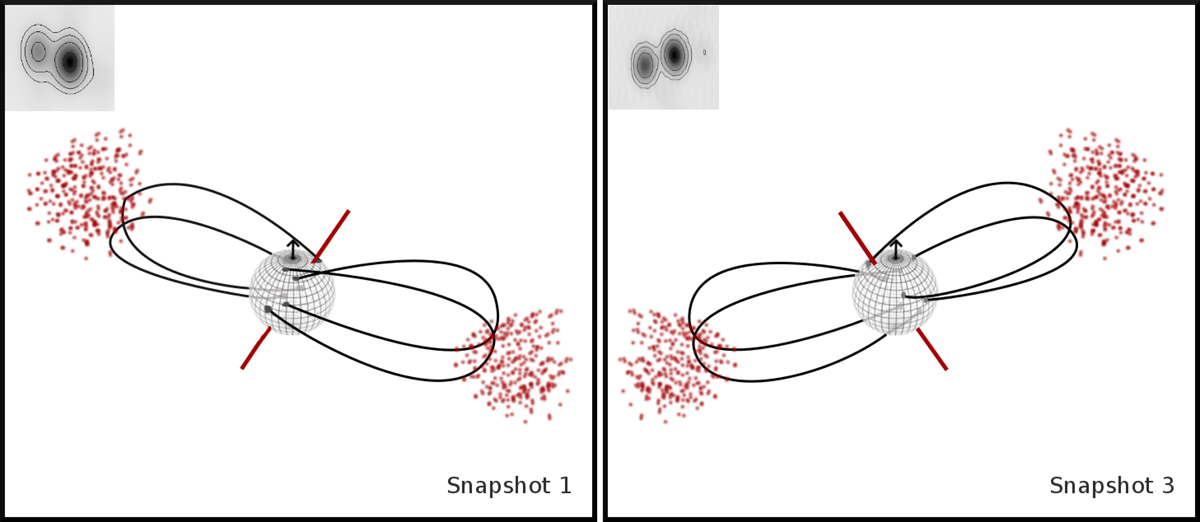
Fig. 5.

Flaring loop model applied to 2007 data. AB Dor A is represented as a sphere with its rotation axis indicated by an arrow (i ∼ 60°, PArot ∼ 0°) and a slightly misaligned magnetic axis (∼20°) which is plotted as a red line. The radio emission is originated by magnetic reconnection or interaction at top of the loop system surrounding the star. As discussed in the main text, the rotation of the star would create snapshot 1 (left panel) and snapshot 3 (right panel).
Current usage metrics show cumulative count of Article Views (full-text article views including HTML views, PDF and ePub downloads, according to the available data) and Abstracts Views on Vision4Press platform.
Data correspond to usage on the plateform after 2015. The current usage metrics is available 48-96 hours after online publication and is updated daily on week days.
Initial download of the metrics may take a while.


