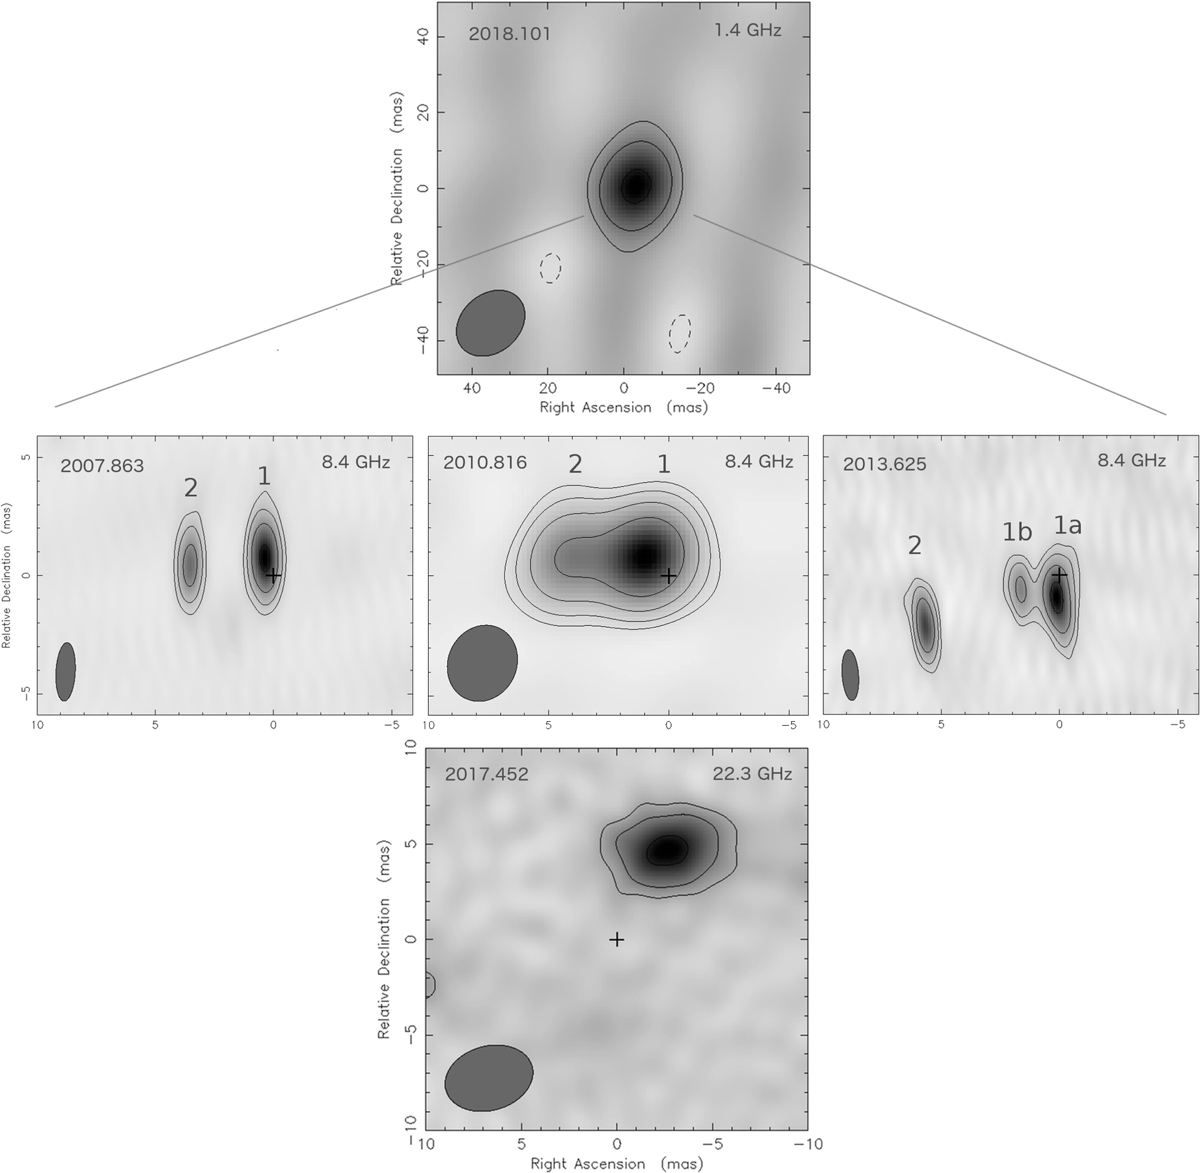
Fig. 1.

LBA images of all our observations of AB Dor A. Here and hereafter, north is up and east is to the left. Numbers (if any) indicate the index assigned to each component. For each image, the synthesized beam is shown at the bottom left corner (see Table 2). The lowest contour level (the remaining levels are spaced by factors of 2), the peak brightness, and background rms noise for each image are as follows: (2007): 11%, 2.35 mJy beam−1, 0.06 mJy beam−1; (2010): 6%, 2.16 mJy beam−1, 0.05 mJy beam−1; (2013): 10%, 1.80 mJy beam−1, 0.05 mJy beam−1; (2017): 22%, 0.714 mJy beam−1, 0.05 mJy beam−1; (2018): 22%, 5.84 mJy beam−1, 0.6 mJy beam−1. All the images are centered, and cross-marked, at the expected positions of AB Dor A according to its proper motion, parallax, and orbital wobble.
Current usage metrics show cumulative count of Article Views (full-text article views including HTML views, PDF and ePub downloads, according to the available data) and Abstracts Views on Vision4Press platform.
Data correspond to usage on the plateform after 2015. The current usage metrics is available 48-96 hours after online publication and is updated daily on week days.
Initial download of the metrics may take a while.


