Fig. 7.
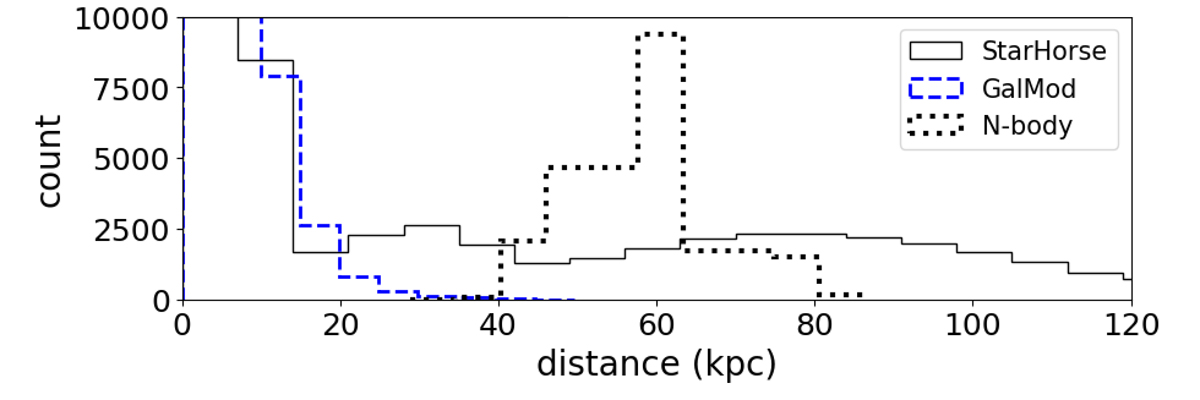
Histograms of distances in the bridge area. The blue dashed line indicates the distribution of the MW foreground stars (GalMod), the black dotted line the distribution of the SMC particles from an N-body simulation (Diaz & Bekki 2012) and the solid line the distance estimates of MC stars from StarHorse (Queiroz et al. 2018).
Current usage metrics show cumulative count of Article Views (full-text article views including HTML views, PDF and ePub downloads, according to the available data) and Abstracts Views on Vision4Press platform.
Data correspond to usage on the plateform after 2015. The current usage metrics is available 48-96 hours after online publication and is updated daily on week days.
Initial download of the metrics may take a while.