Fig. 3.
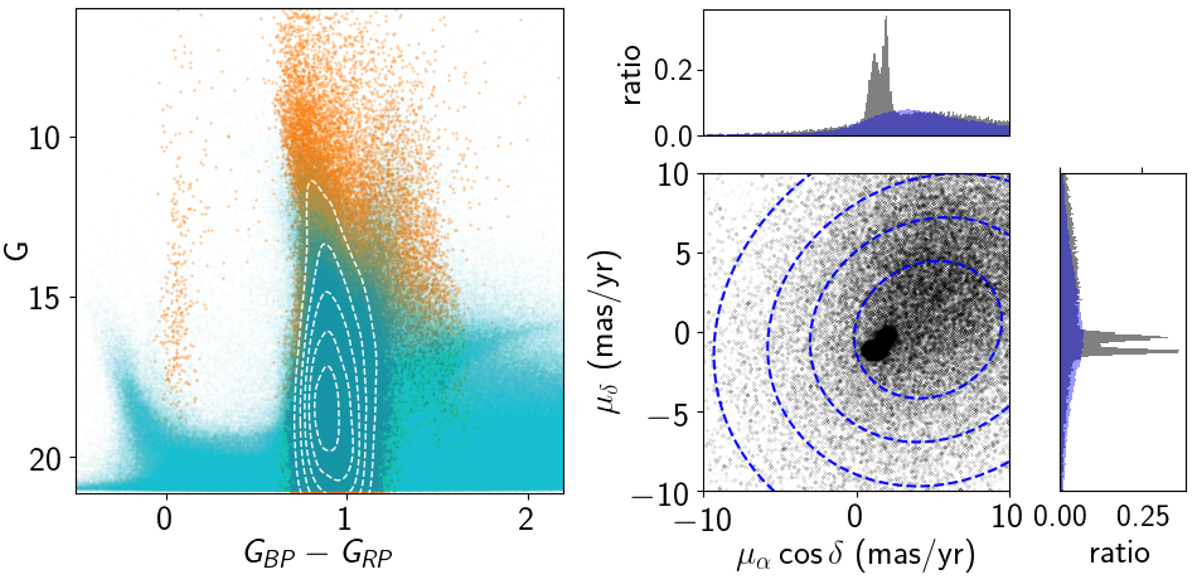
Left: CMD of the GalMod theoretical population synthesis model (orange) overlayed on all Gaia DR2 sources (cyan) of the same area of the Magellanic Bridge. The white contour levels show the model number density distribution in steps of 20 000 sources starting at the centre. Right: proper motion distribution in right ascension and declination of Gaia DR2 sources (black). The contour levels of the foreground simulation are indicated with blue dashed lines and contain each 20 000 sources. The corresponding ratios between the two proper motion components for the Gaia DR2 proper motions are shown in grey and for the GalMod simulation in blue. The LMC and the SMC are visible as two narrow peaks, while the MW foreground stars are more spread out.
Current usage metrics show cumulative count of Article Views (full-text article views including HTML views, PDF and ePub downloads, according to the available data) and Abstracts Views on Vision4Press platform.
Data correspond to usage on the plateform after 2015. The current usage metrics is available 48-96 hours after online publication and is updated daily on week days.
Initial download of the metrics may take a while.