Fig. 2.
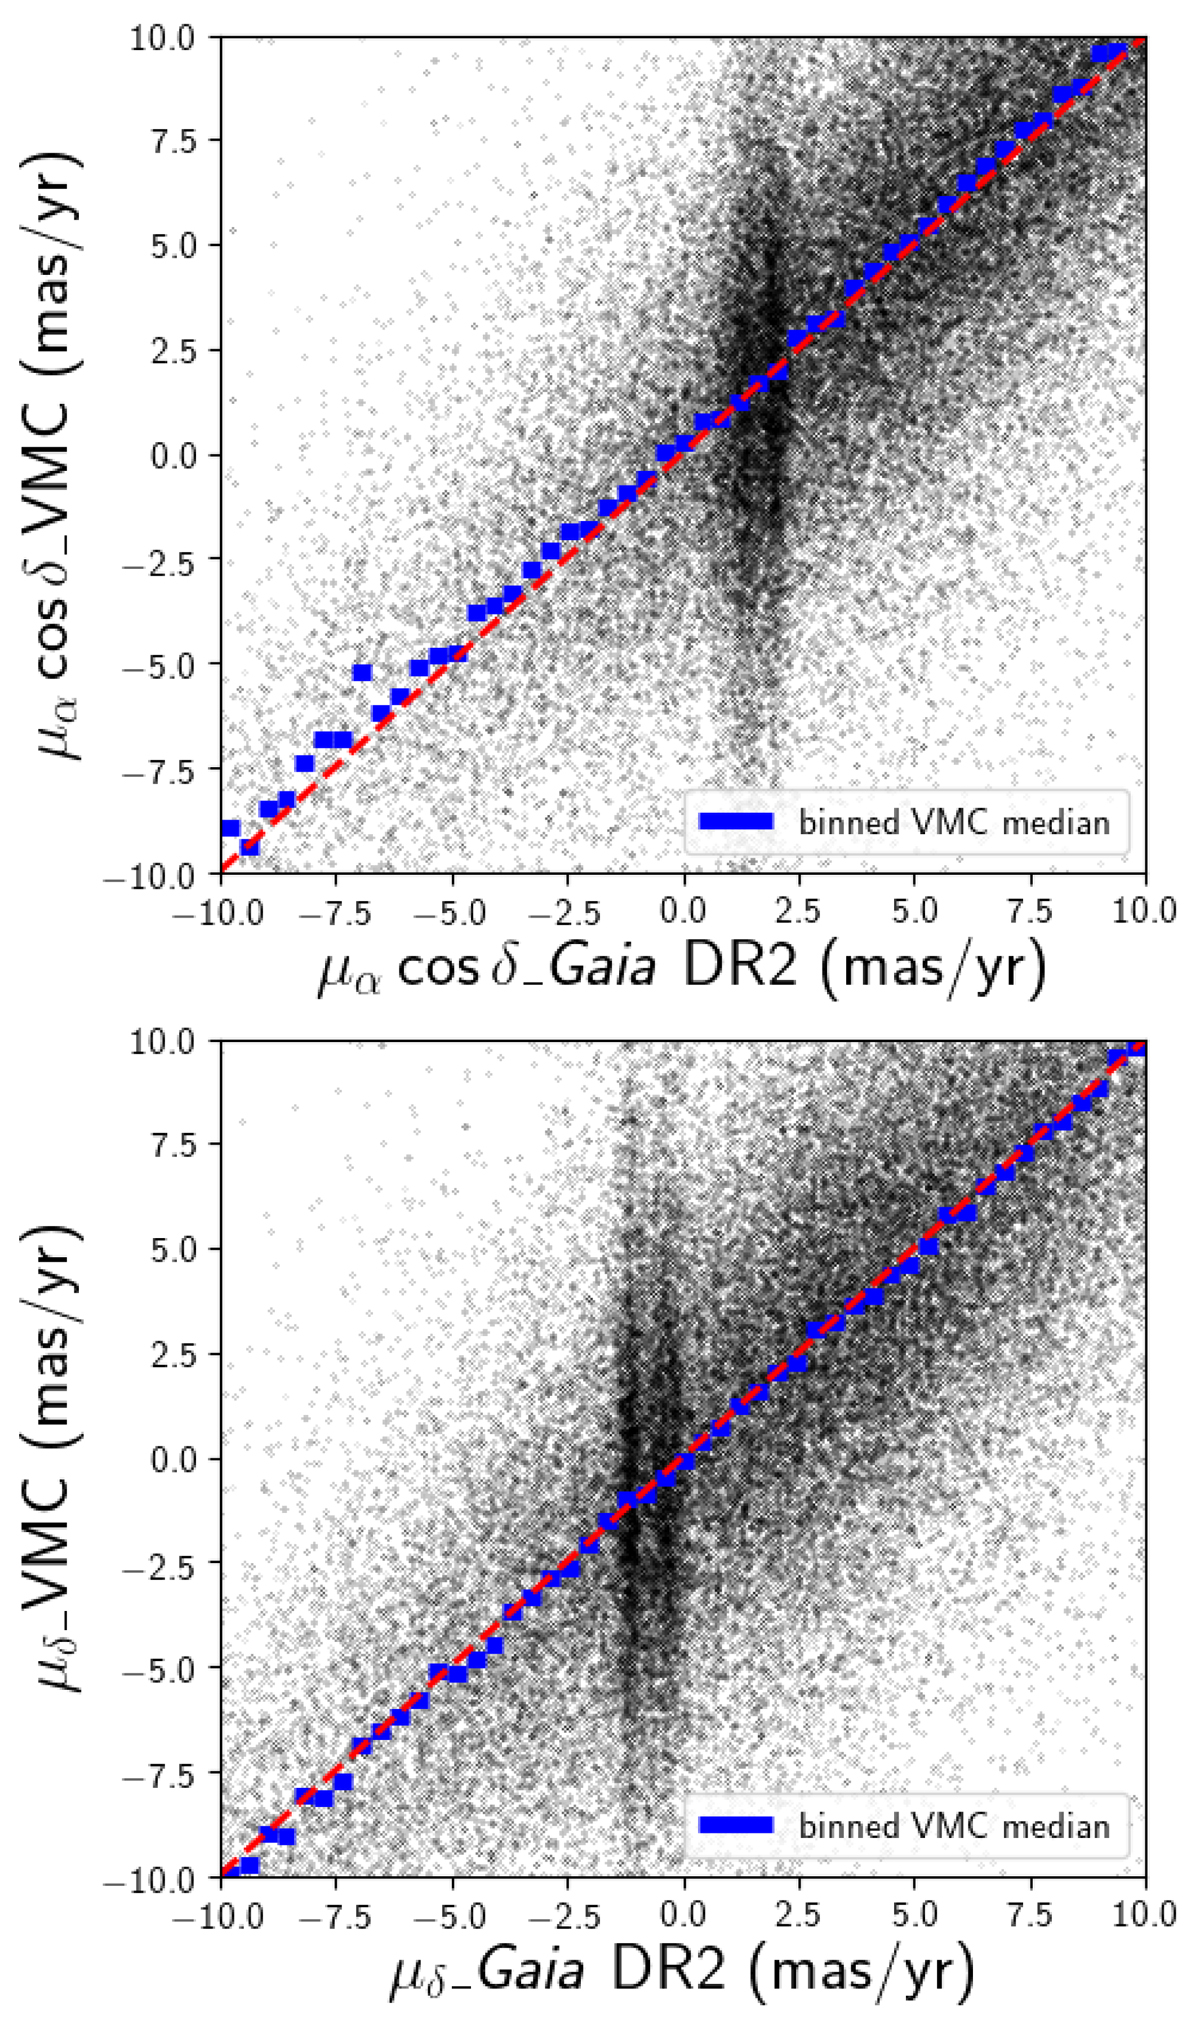
VMC proper motions as a function of their corresponding Gaia DR2 proper motions for all stars of the cross-matched catalogues. Regions of highest density correspond to the MCs. They are visible as two vertical features in both panels. The left feature corresponds to the SMC (top: ∼1.2 mas yr−1, bottom: ∼−1 mas yr−1), while the right feature represents the LMC (top: ∼2 mas yr−1, bottom: ∼−0.5 mas yr−1). The red dashed line shows the one to one correlation and the median VMC proper motions are shown in blue.
Current usage metrics show cumulative count of Article Views (full-text article views including HTML views, PDF and ePub downloads, according to the available data) and Abstracts Views on Vision4Press platform.
Data correspond to usage on the plateform after 2015. The current usage metrics is available 48-96 hours after online publication and is updated daily on week days.
Initial download of the metrics may take a while.