Fig. 10.
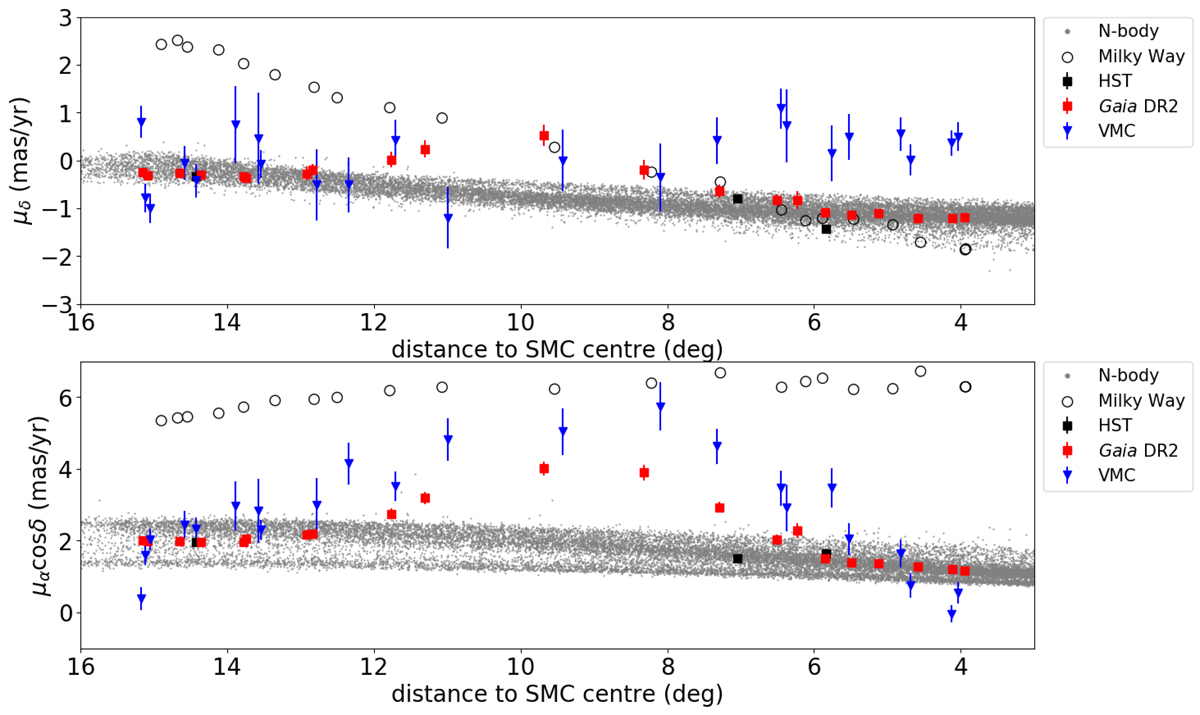
Proper motion in μδ and μα cos δ as a function of projected distance from the SMC centre. Grey dots in the background indicate the distribution of the simulated particles (Diaz & Bekki 2012). Blue triangles show the median VMC proper motion, while the red squares show the median Gaia DR2 proper motion of stars across the Magellanic Bridge. Black diamonds indicate HST proper motion measurements (Zivick et al. 2019). Simulated proper motions (GalMod) of the Milky Way foreground stars are shown as black circles.
Current usage metrics show cumulative count of Article Views (full-text article views including HTML views, PDF and ePub downloads, according to the available data) and Abstracts Views on Vision4Press platform.
Data correspond to usage on the plateform after 2015. The current usage metrics is available 48-96 hours after online publication and is updated daily on week days.
Initial download of the metrics may take a while.