Fig. 9.
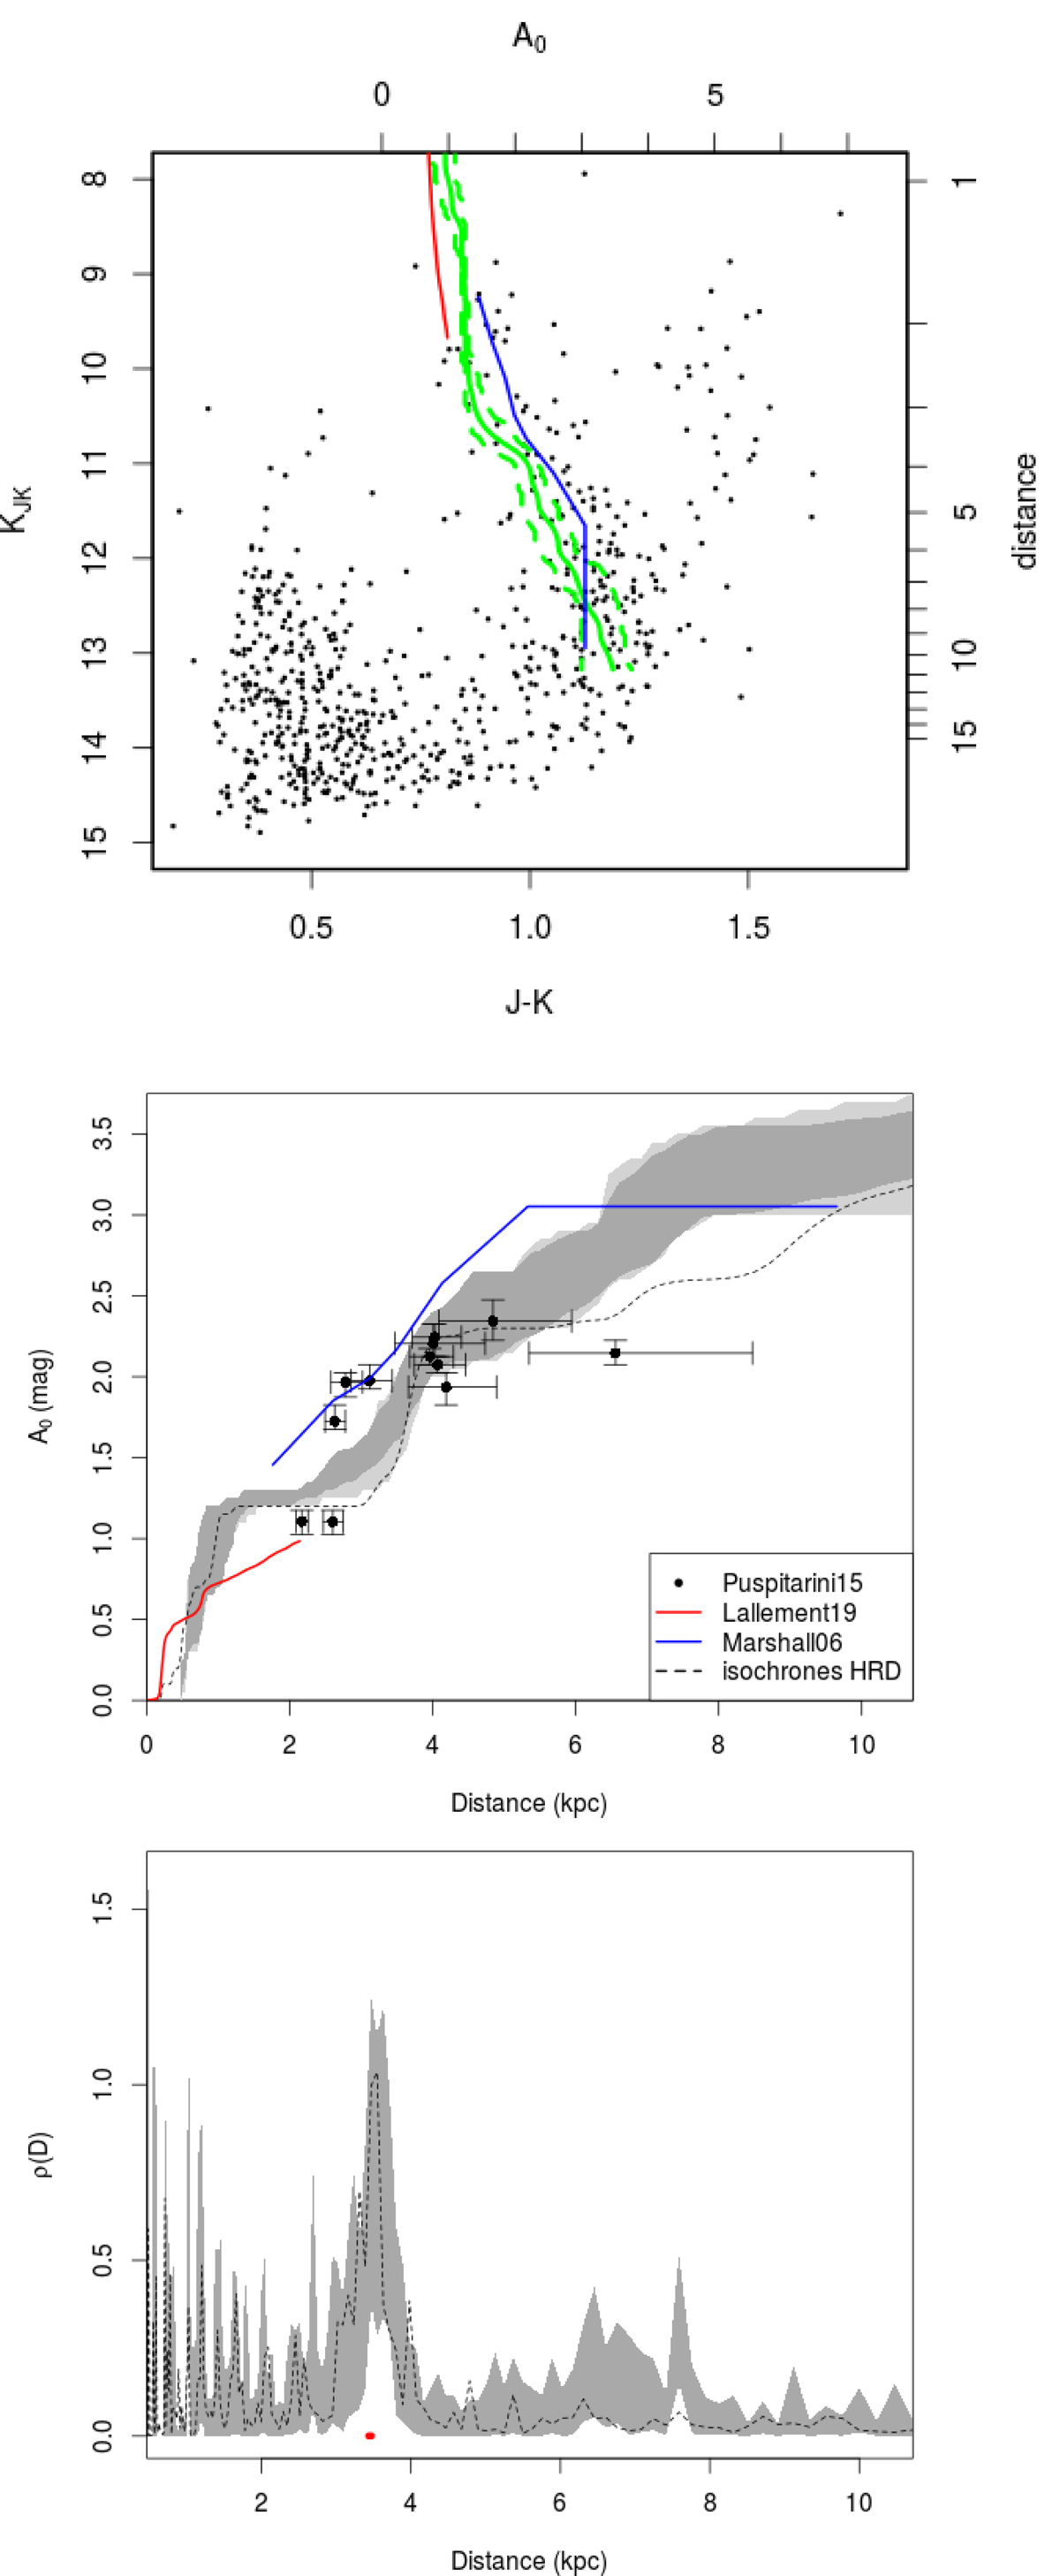
Field of NGC 4815. Top: 2MASS CMD. In green the red clump track corresponding to our results with its 1σ confidence interval, in blue the Marshall et al. (2006) results and in red the Lallement et al. (2019) ones. Middle: extinction, 1σ confidence interval in grey (see Fig. 8). Dotted line: FEDReD result using the isochrone HRD. Black points: Puspitarini et al. (2015) updated with the Gaia DR2 distances, in red for members according to Friel et al. (2014). Bottom: stellar density. The cluster distance (Cantat-Gaudin et al. 2018) is indicated in red.
Current usage metrics show cumulative count of Article Views (full-text article views including HTML views, PDF and ePub downloads, according to the available data) and Abstracts Views on Vision4Press platform.
Data correspond to usage on the plateform after 2015. The current usage metrics is available 48-96 hours after online publication and is updated daily on week days.
Initial download of the metrics may take a while.