Fig. 8.
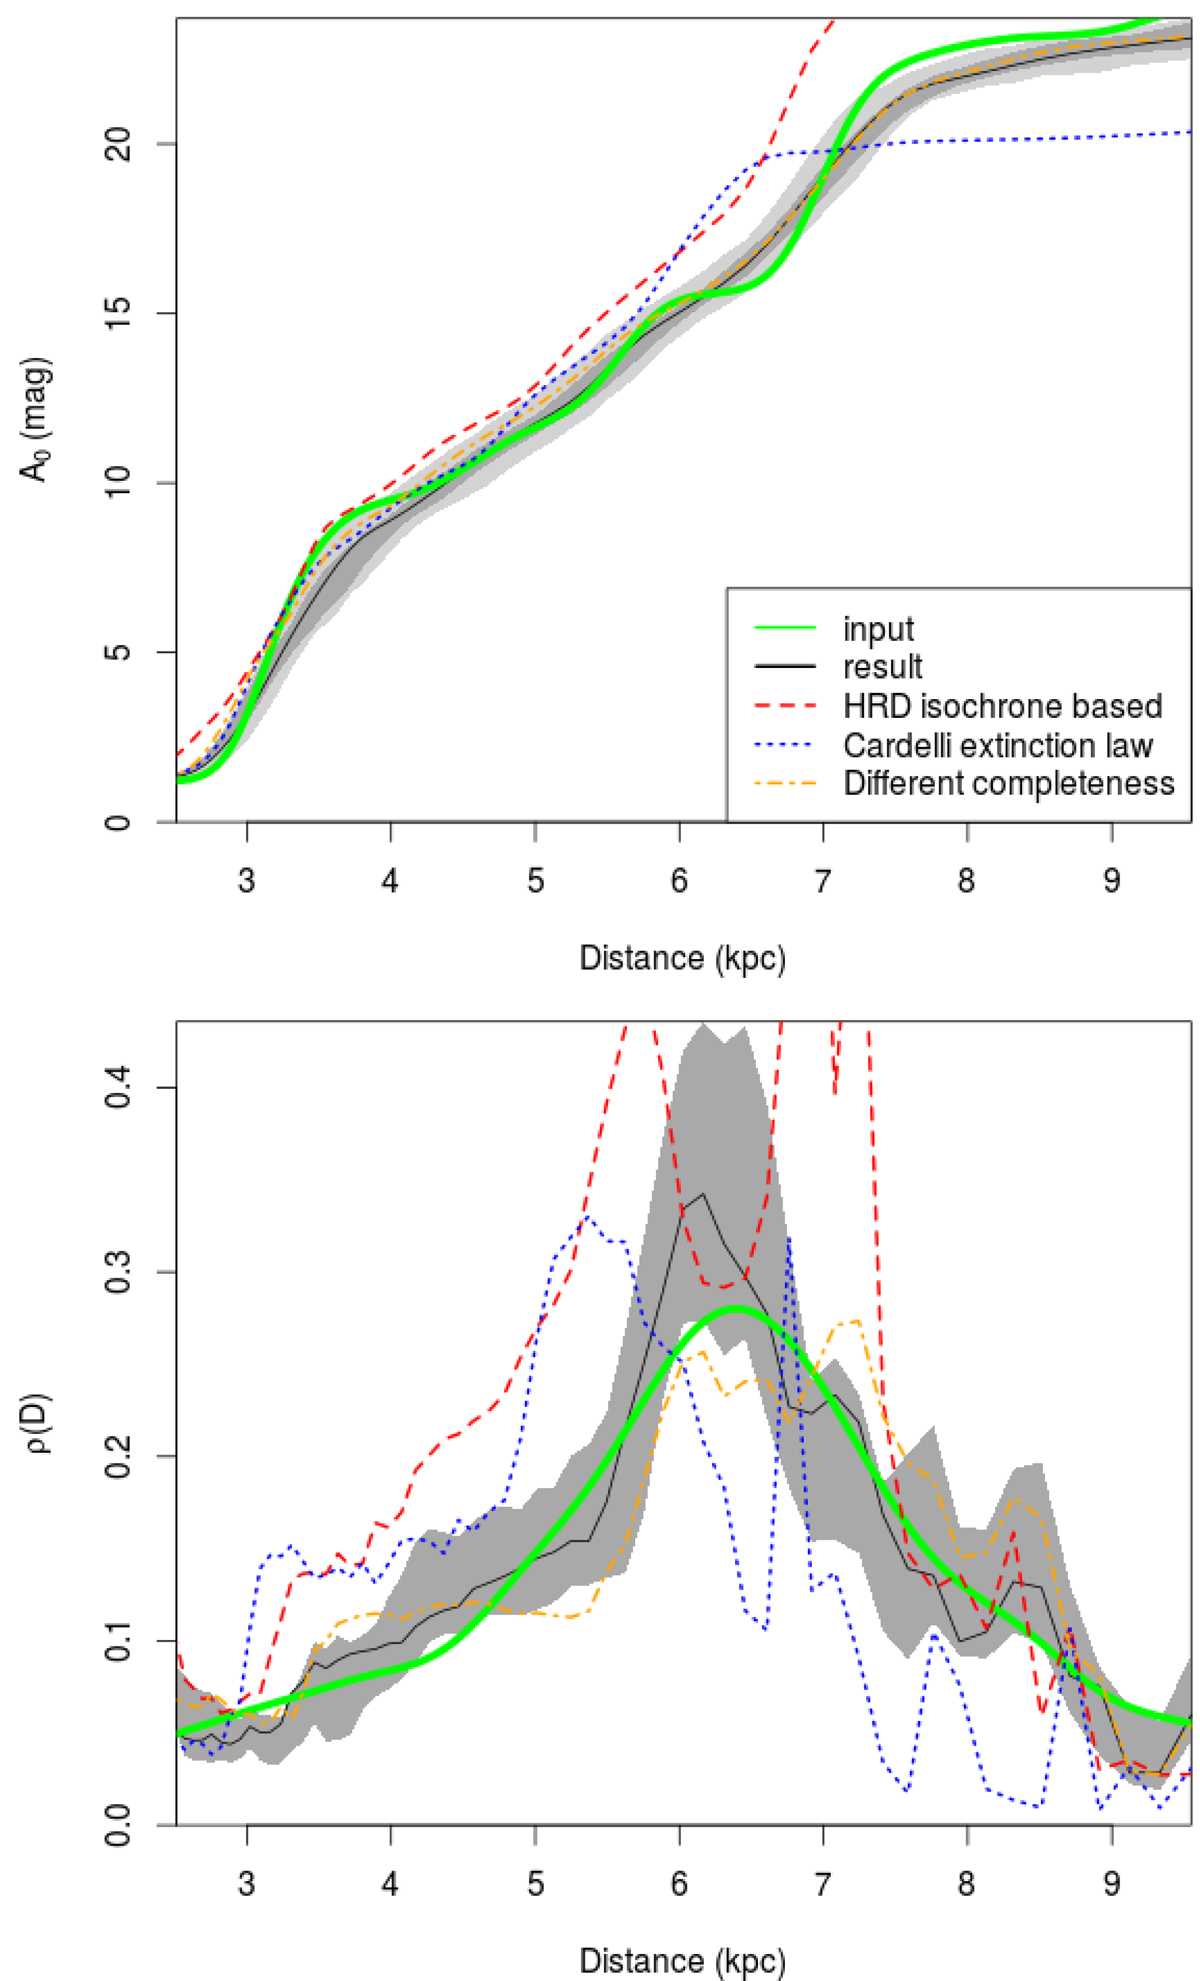
Results of the deconvolution of the simulation for A0(D) (top) and ρ(D) (bottom) within the [Dmin,Dmax] distance range. The black line is the deconvolution result. The light grey area in the top panel corresponds to the 1σ confidence interval of A0(D) derived from the full P(A0|D) (Fig. 2) while the darker grey area in both panels shows the 1σ confidence interval derived from the bootstrap. The green line is the input relation used in the simulation. Red dashed line: isochrones HRD. Blue dotted line: Cardelli et al. (1989) extinction law. Orange dot-dashed line: assuming completeness parameters α = 10 and β = 1.
Current usage metrics show cumulative count of Article Views (full-text article views including HTML views, PDF and ePub downloads, according to the available data) and Abstracts Views on Vision4Press platform.
Data correspond to usage on the plateform after 2015. The current usage metrics is available 48-96 hours after online publication and is updated daily on week days.
Initial download of the metrics may take a while.