Fig. 10.
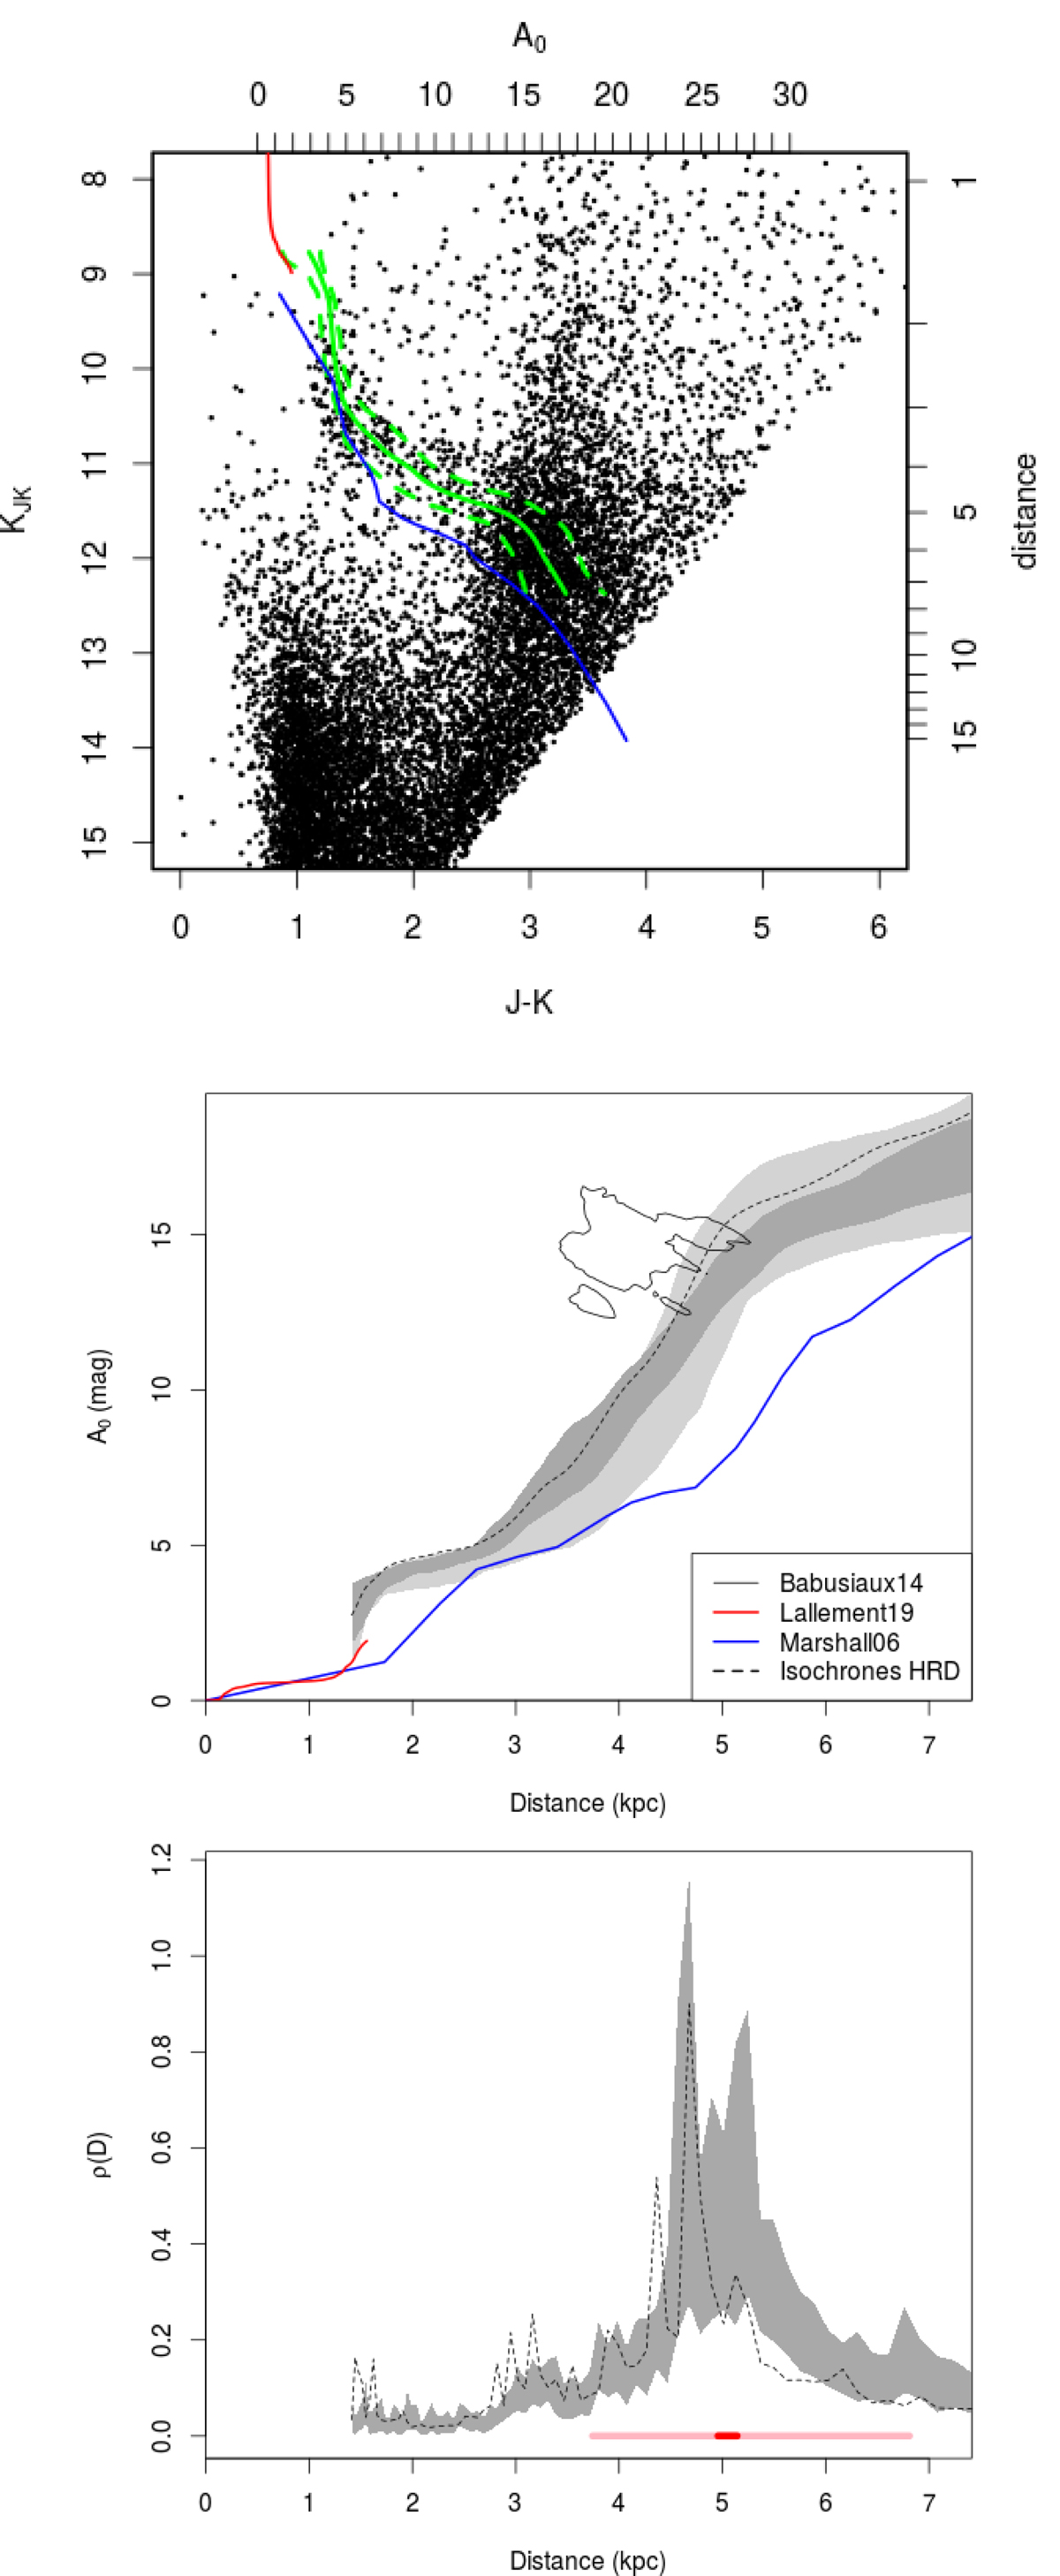
Field l = 9.6° ,b = 0°. Top: UKIDSS CMD. In green the red clump track corresponding to our results with its 1σ confidence interval, in blue the Marshall et al. (2006) results, in green the Lallement et al. (2019) ones. Middle: extinction, 1σ confidence interval in grey (see Fig. 8). Dotted line: FEDReD result using the isochrone HRD. Thin black line: isocontours of the spectroscopic sample results of Babusiaux et al. (2014). Bottom: stellar density. The bar distance determined by Babusiaux & Gilmore (2005) is indicated with a red line and the distance spread in light red.
Current usage metrics show cumulative count of Article Views (full-text article views including HTML views, PDF and ePub downloads, according to the available data) and Abstracts Views on Vision4Press platform.
Data correspond to usage on the plateform after 2015. The current usage metrics is available 48-96 hours after online publication and is updated daily on week days.
Initial download of the metrics may take a while.