Fig. 16.
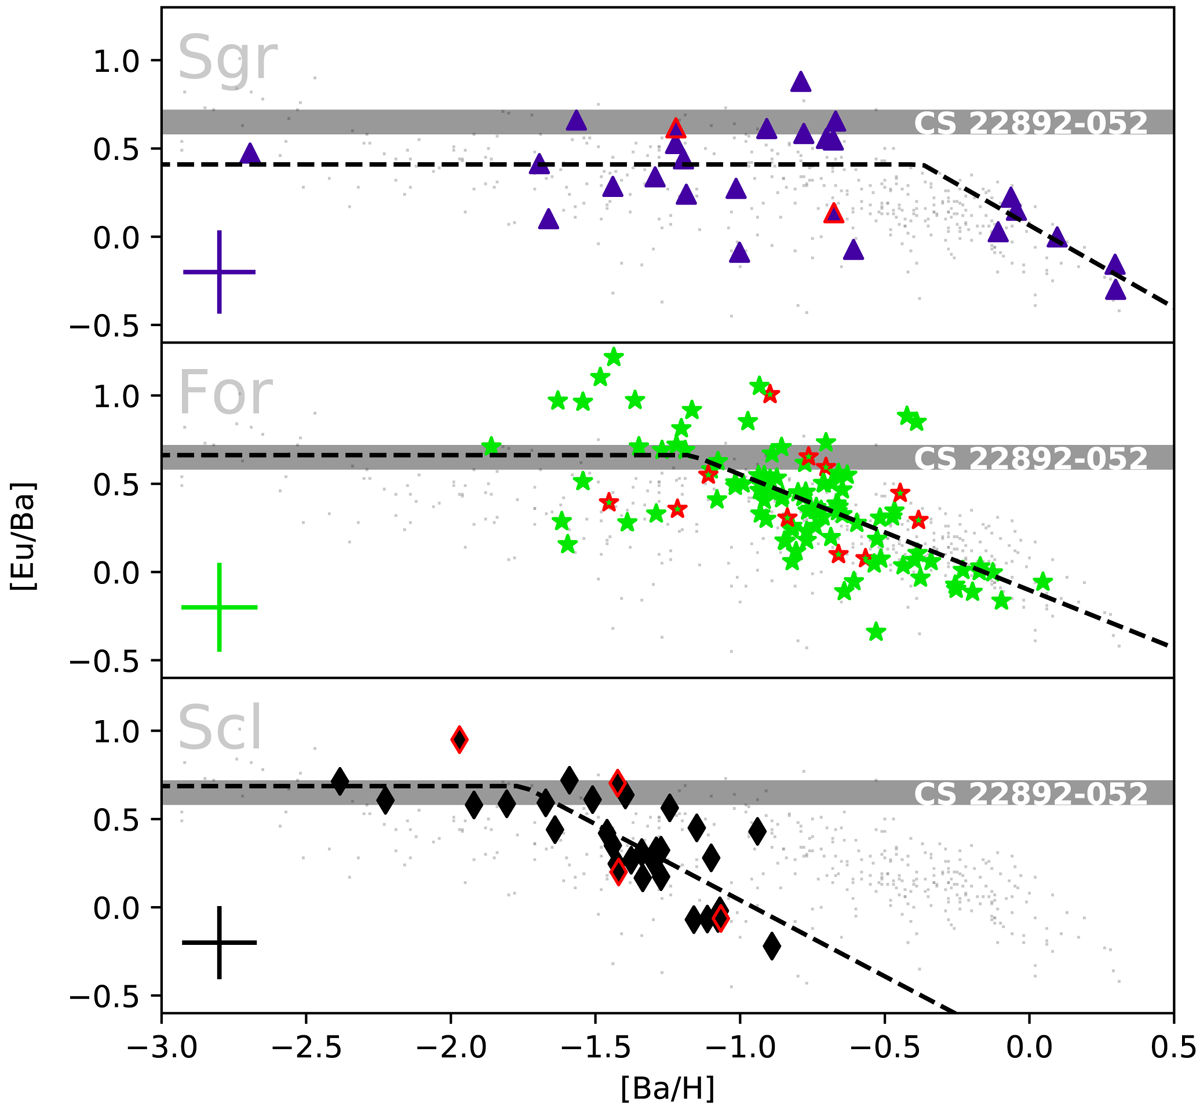
[Eu/Ba] as an indicator of the s-process contribution to Ba. Red symbols indicate stars with unreasonable parallax. The gray band shows the highly r-process enriched star CS 22892−052 (Sneden et al. 2003). Gray dots indicate stars of the MW (Reddy et al. 2003, 2006; Cayrel et al. 2004). The median error is indicated in the lower left of each panel.
Current usage metrics show cumulative count of Article Views (full-text article views including HTML views, PDF and ePub downloads, according to the available data) and Abstracts Views on Vision4Press platform.
Data correspond to usage on the plateform after 2015. The current usage metrics is available 48-96 hours after online publication and is updated daily on week days.
Initial download of the metrics may take a while.