Fig. 15.
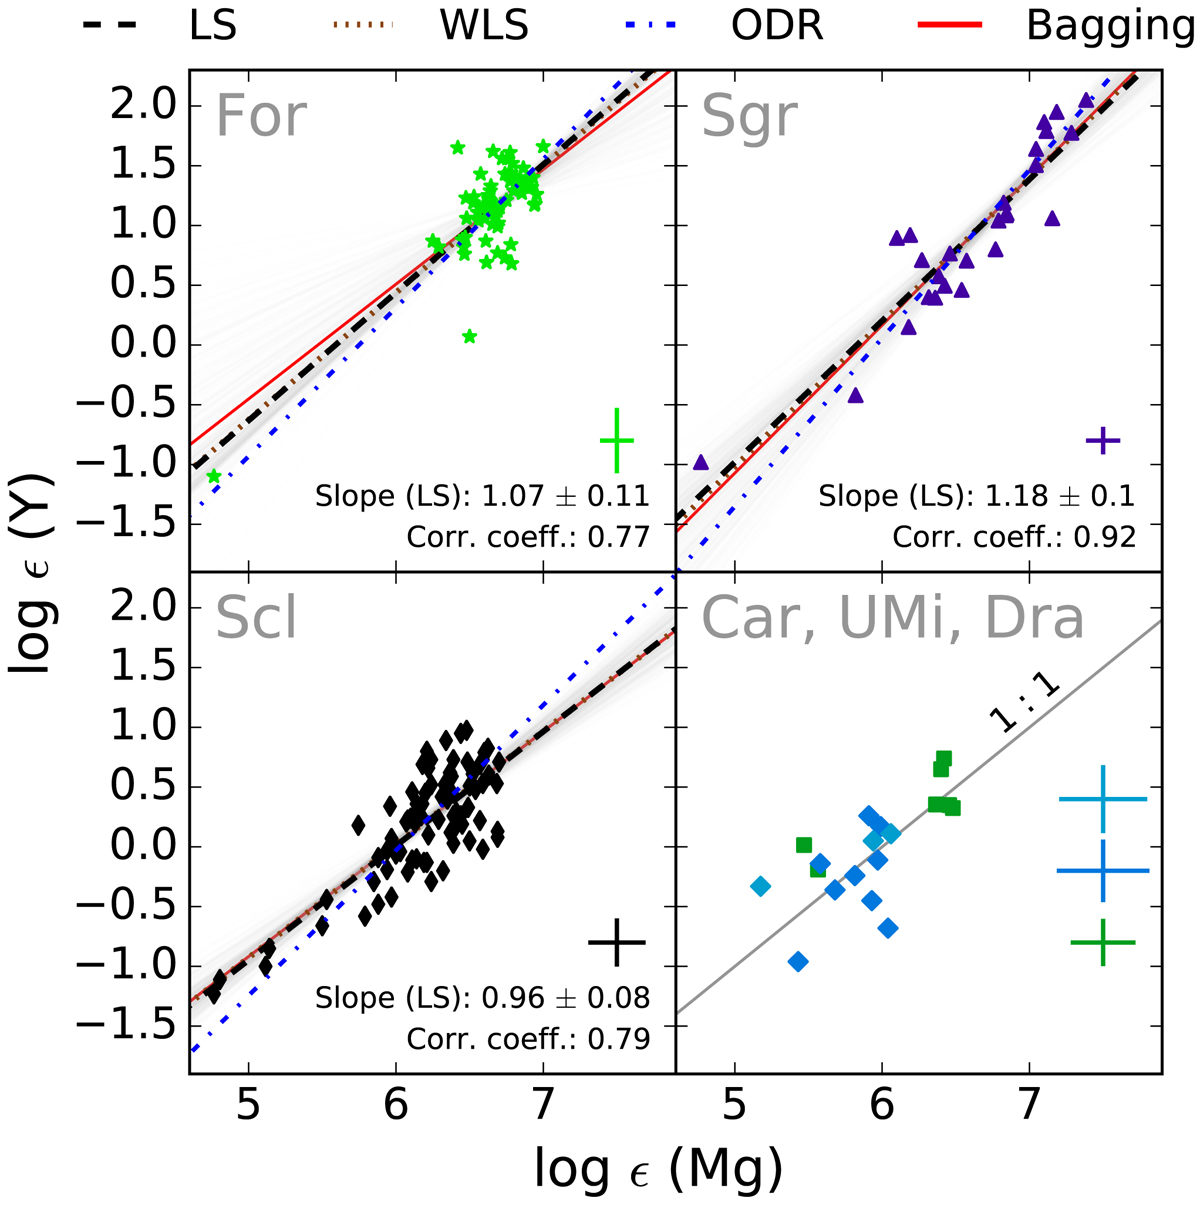
Absolute yttrium abundance versus absolute magnesium abundance together with a linear fit. Symbols are the same as in Fig. 5. Different line styles and colors indicate different fitting techniques. LS denotes a least squares fitting without any weights. The slope given in each panel is calculated with this fitting technique. WLS indicates a weighted least squares fit, ODR stands for an orthogonal distance regression, and Bagging for a bootstrapping aggregation. Light gray lines indicate different slopes that are involved in the bootstrapping algorithm. The line in the lower right panel indicates a 1:1 correlation without performing a fit.
Current usage metrics show cumulative count of Article Views (full-text article views including HTML views, PDF and ePub downloads, according to the available data) and Abstracts Views on Vision4Press platform.
Data correspond to usage on the plateform after 2015. The current usage metrics is available 48-96 hours after online publication and is updated daily on week days.
Initial download of the metrics may take a while.