Fig. 11.
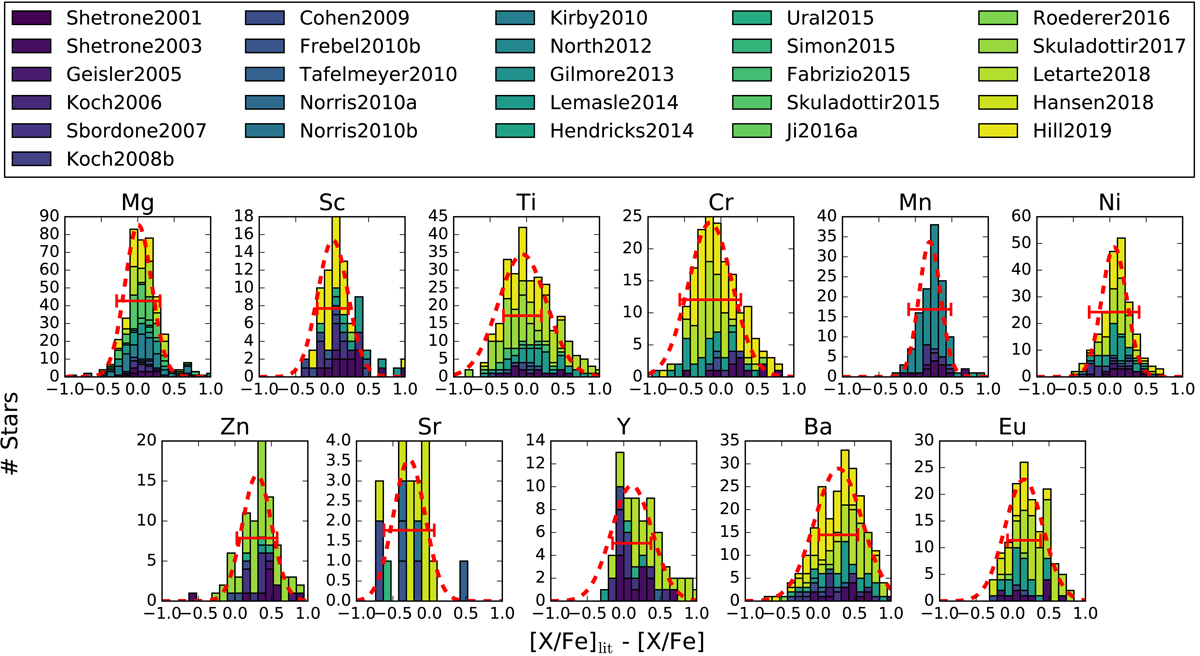
Comparison of derived [X/Fe] abundances with various literature values. The dashed line depicts a Gaussian fit and the horizontal line indicates the FWHM one would expect due to the average error of the abundances. Literature values are taken from: Skúladóttir et al. (2015, 2017), Hendricks et al. (2014a), Cohen & Huang (2009), Hill et al. (2019), Letarte et al. (2018), Shetrone et al. (2003), Gilmore et al. (2013), Ural et al. (2015), Geisler et al. (2005), Koch et al. (2006, 2008), Roederer et al. (2016), Norris et al. (2010a,b), North et al. (2012), Sbordone et al. (2007), Simon et al. (2015), Ji et al. (2016a), Tafelmeyer et al. (2010), Kirby et al. (2010), Fabrizio et al. (2015), Shetrone et al. (2001), Lemasle et al. (2014), Frebel et al. (2010a), and Hansen et al. (2018).
Current usage metrics show cumulative count of Article Views (full-text article views including HTML views, PDF and ePub downloads, according to the available data) and Abstracts Views on Vision4Press platform.
Data correspond to usage on the plateform after 2015. The current usage metrics is available 48-96 hours after online publication and is updated daily on week days.
Initial download of the metrics may take a while.