Fig. 9.
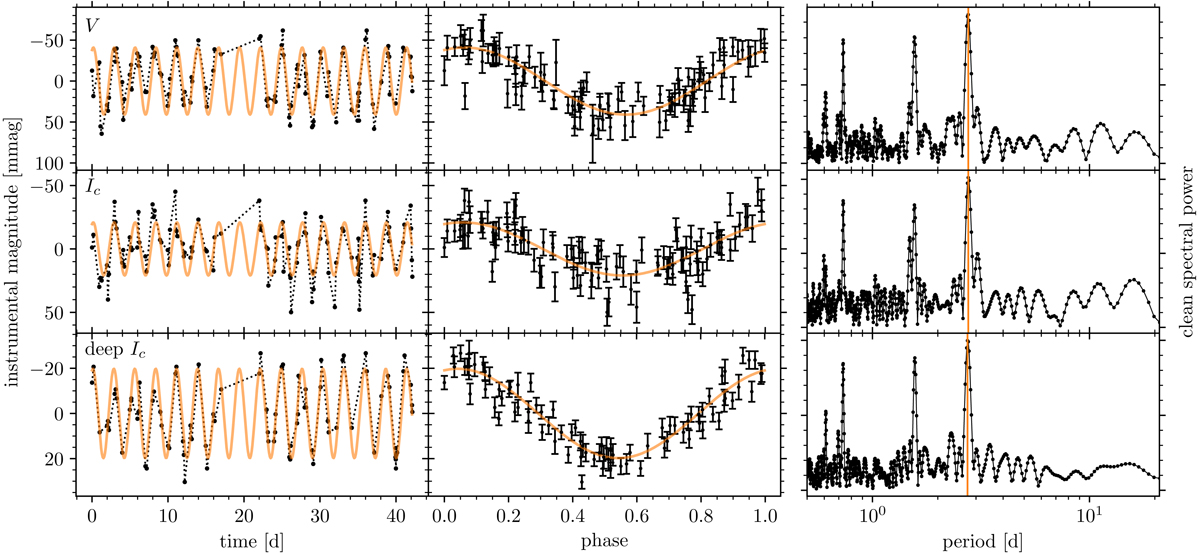
Multiple light curves for the same spectral type M1 star (Gaia DR2 5290816800011541504, V = 17.7, (V − Ks)0 = 3.9) in V, Ic, and deep Ic, demonstrating both similarities and differences. From left to right: light curve in the time (left) and phase domains (centre), and the CLEAN periodograms (right). This illustrates how a period of 2.75 d is confirmed within our data set. The rotation period is marked in the CLEAN periodogram with an orange line at the highest peak. The three highest secondary peaks in the periodogram are beat frequencies of the rotation period with the 1 d alias. This figure also shows the behaviour of measurement uncertainties in the different bands. The Ic band (middle row) shows especially large uncertainties relative to the light curve amplitude whereas V (top) and in particular the longer-exposed deep Ic (bottom) are more tightly correlated.
Current usage metrics show cumulative count of Article Views (full-text article views including HTML views, PDF and ePub downloads, according to the available data) and Abstracts Views on Vision4Press platform.
Data correspond to usage on the plateform after 2015. The current usage metrics is available 48-96 hours after online publication and is updated daily on week days.
Initial download of the metrics may take a while.