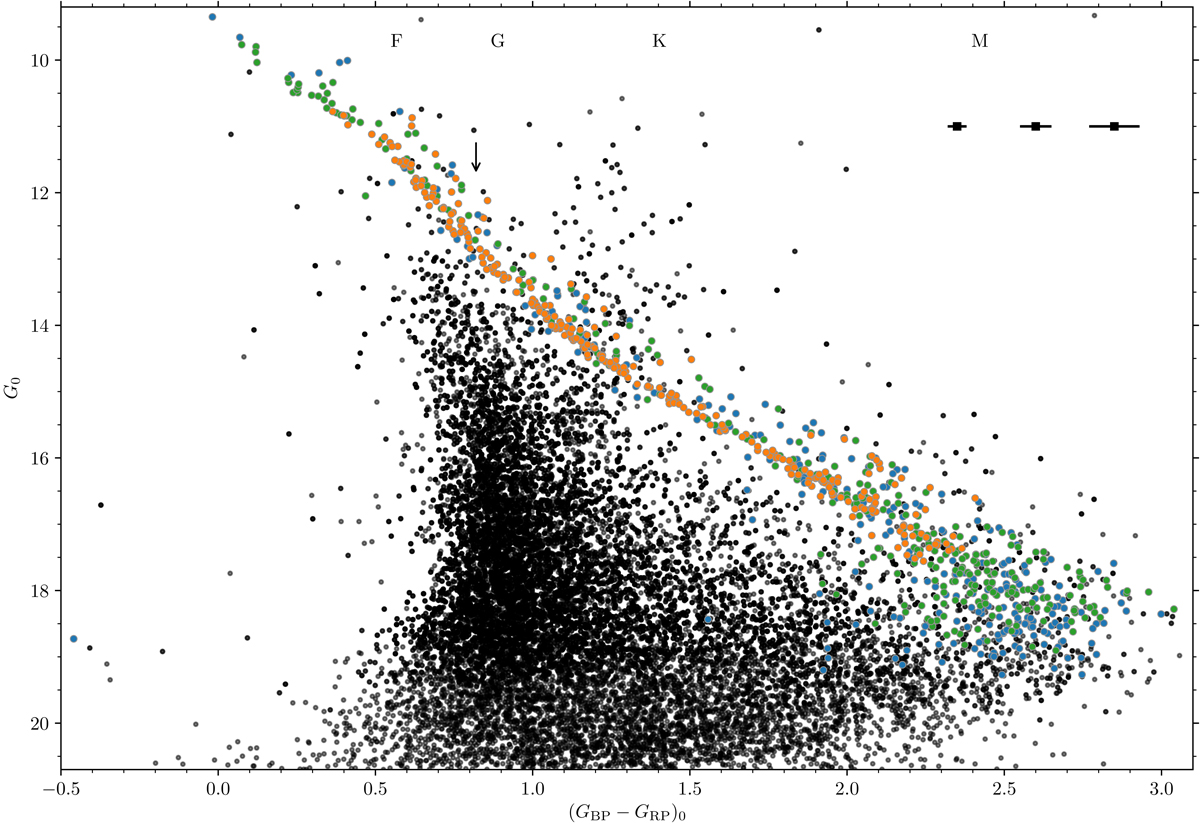
Fig. 7.

Gaia DR2 colour-magnitude diagram for all stars for which we constructed light curves. The best-defined members (satisfying all four criteria) are marked in orange, members according to three criteria are marked in green, and those fulfilling only two in blue. Non-members are marked in black. We note that photometric binaries are retained. The arrow indicates the colour of the Sun (Casagrande & VandenBerg 2018) for context. The spectral classifications at the top are according to Pecaut & Mamajek (2013). In the upper right we display representative uncertainties for stars on the cluster sequence. Uncertainties for (GBP − GRP)0 < 2.3 and for G are within the symbol size and are not shown here.
Current usage metrics show cumulative count of Article Views (full-text article views including HTML views, PDF and ePub downloads, according to the available data) and Abstracts Views on Vision4Press platform.
Data correspond to usage on the plateform after 2015. The current usage metrics is available 48-96 hours after online publication and is updated daily on week days.
Initial download of the metrics may take a while.


