Fig. 3.
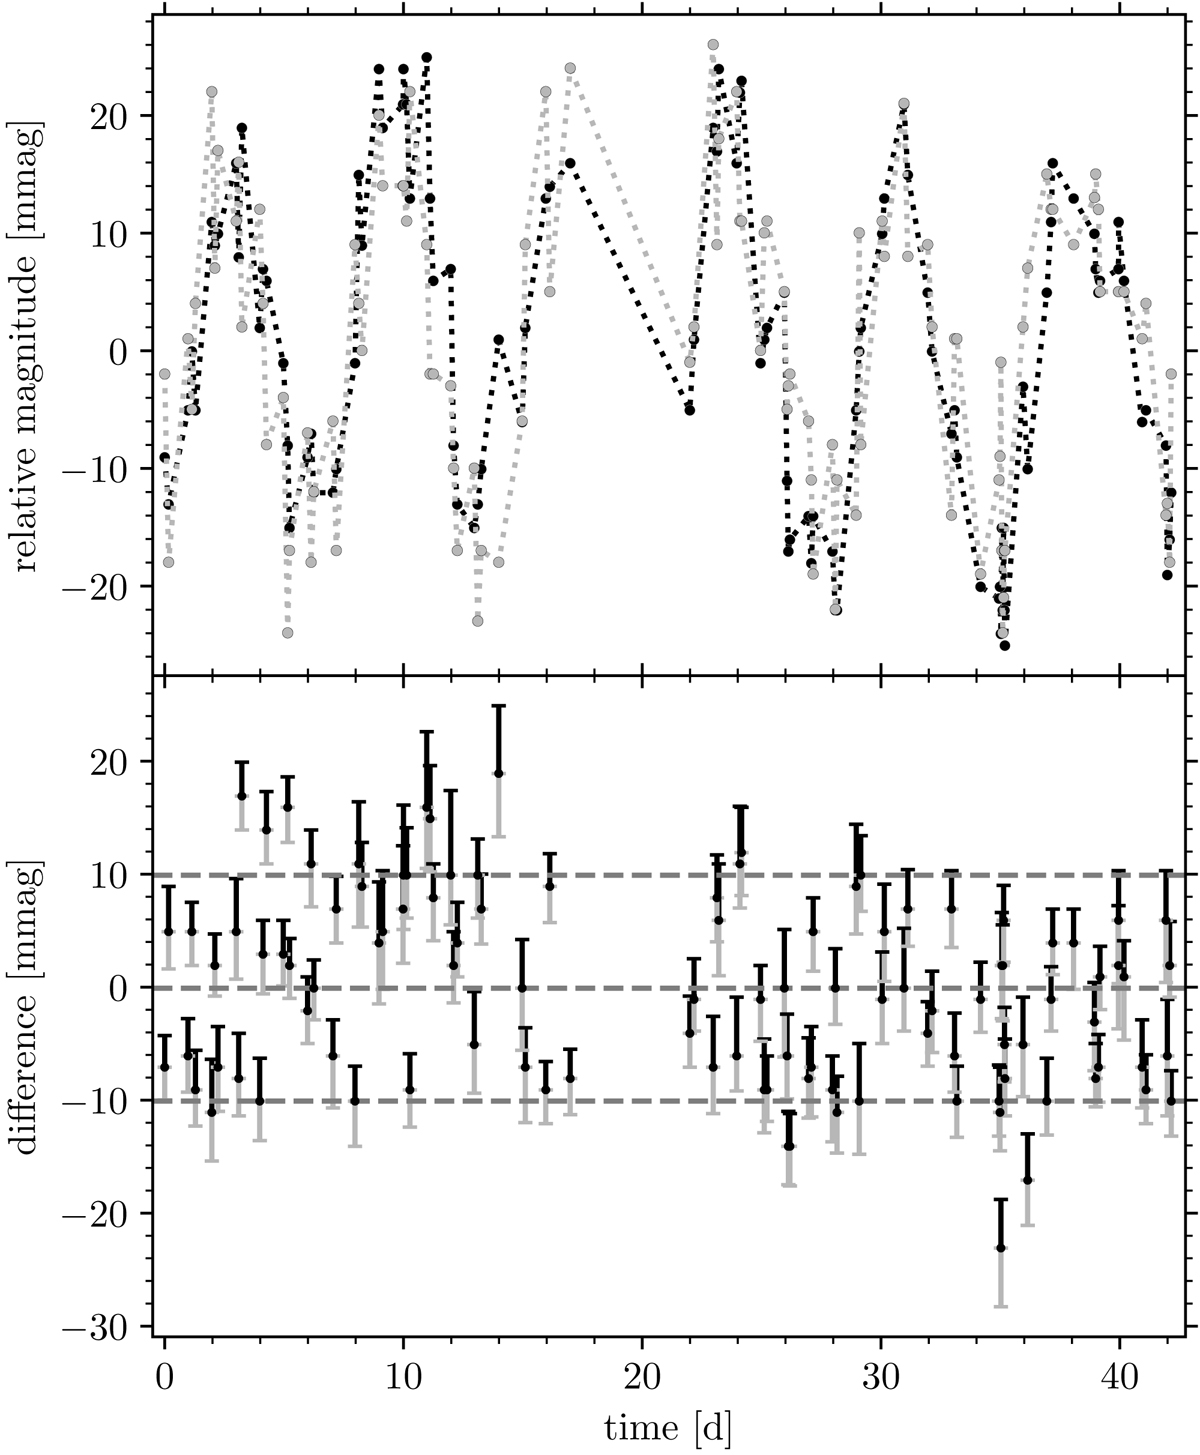
Two V band light curves of the same star Gaia DR2 5290833258325773312 from fields 1 and 2 (upper panel) and their differences (lower panel), demonstrating the extent of (dis)agreement. The uncertainties shown in the lower panel are those estimated by DAOPHOT II for each data point. The upper part of the error bar (black) corresponds to the black light curve while the lower one corresponds to the grey light curve. The three dashed lines, from top to bottom, are the ninetieth, the fiftieth (median), and the tenth percentile of the light curve differences.
Current usage metrics show cumulative count of Article Views (full-text article views including HTML views, PDF and ePub downloads, according to the available data) and Abstracts Views on Vision4Press platform.
Data correspond to usage on the plateform after 2015. The current usage metrics is available 48-96 hours after online publication and is updated daily on week days.
Initial download of the metrics may take a while.