Fig. B.2.
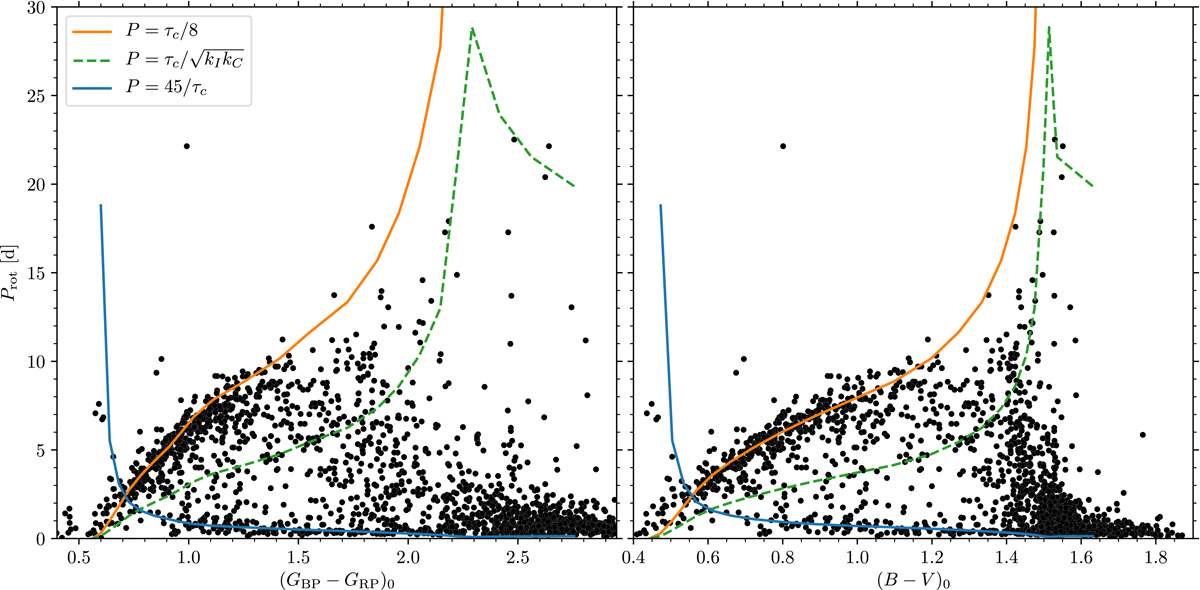
Simple colour-independent way to reproduce the ZAMS rotational distribution. Colour-period diagrams in GaiaGBP − GRP and B − V colours for the combined representative ZAMS distribution (data as in Fig. 17), showing how the elementary functions P = 45/τc and P = τc/8, of the convective turnover timescale τc may be used to specify its fast and slow rotation limits. The dashed line ![]() separates the fast and slow rotator regions in the Barnes & Kim (2010) model and approximately describes the less-densely occupied region between the fast- and slow rotator regions. This model is not relevant for the M dwarfs that are still on the pre-main sequence. See text in Sect. 7.3.
separates the fast and slow rotator regions in the Barnes & Kim (2010) model and approximately describes the less-densely occupied region between the fast- and slow rotator regions. This model is not relevant for the M dwarfs that are still on the pre-main sequence. See text in Sect. 7.3.
Current usage metrics show cumulative count of Article Views (full-text article views including HTML views, PDF and ePub downloads, according to the available data) and Abstracts Views on Vision4Press platform.
Data correspond to usage on the plateform after 2015. The current usage metrics is available 48-96 hours after online publication and is updated daily on week days.
Initial download of the metrics may take a while.